
Sea Mullet – NSW Estuary General Fishery
Assessment Summary
Sea Mullet
Unit of Assessment
Product Name: Sea Mullet
Species: Mugil cephalus
Stock: New South Wales
Gear type: Haul net and mesh net (gillnet)
Fishery: NSW Estuary General Fishery
Year of Assessment: 2017
Fishery Overview
The Estuary General Fishery (EGF) is a multi-species, multi-method fishery that may operate in 76 of the NSW’s estuarine systems. It is the most diverse commercial fishery in NSW and comprises up to 600 fishing businesses authorised to utilise 17 types of fishing gear (see web link below). The fishery is broken up into 7 regions along the NSW coast and up to 9 fishing endorsements exist in each region.
The Fishery includes all forms of commercial estuarine fishing (other than estuary prawn trawling) in addition to the gathering of pipis and beachworms from ocean beaches. The most frequently used fishing methods are mesh and haul netting, which are both assessed in this report. Other methods used include trapping, hand-lining and hand-gathering.
On average, the 9 species that make up over 80% of landings by weight are Sea Mullet (Mugil cephalus), Luderick (Girella tricuspidata), school prawn (Metapenaeus macleayi), Yellowfin Bream (Acanthopagrus australis), Dusky Flathead (Platycephalus fuscus), mud crab (Scylla serrata), blue swimmer crab (Portunus pelagicus), sand whiting (Sillago ciliata) and silver biddy (Gerres subfasciatus).
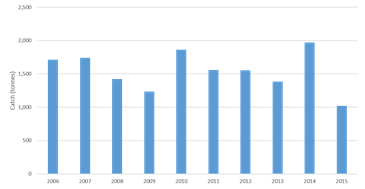
Figure 1 Trends in total catch
Further information on the fishery is available at: http://www.dpi.nsw.gov.au/fisheries/commercial/fisheries/egf#Estuary-General-Fishery
Risk Scores
|
Performance Indicator |
Sea Mullet – Mesh net |
Sea Mullet – Haul net |
|
COMPONENT 1 |
||
|
1A: Stock Status |
MEDIUM RISK |
MEDIUM RISK |
|
1B: Harvest Strategy |
PRECAUTIONARY HIGH RISK |
PRECAUTIONARY HIGH RISK |
|
1C: Information and Assessment |
MEDIUM RISK |
MEDIUM RISK |
|
OVERALL |
MEDIUM RISK |
MEDIUM RISK |
|
COMPONENT 2 |
||
|
PRECAUTIONARY HIGH RISK |
PRECAUTIONARY HIGH RISK |
|
|
2B: ETP Species |
MEDIUM RISK |
MEDIUM RISK |
|
2C: Habitats |
LOW RISK |
LOW RISK |
|
2D: Ecosystems |
LOW RISK |
LOW RISK |
|
OVERALL |
MEDIUM RISK |
MEDIUM RISK |
|
COMPONENT 3 |
||
|
3A: Governance and Policy |
LOW RISK |
LOW RISK |
|
3B: Fishery-specific Management System |
MEDIUM RISK |
MEDIUM RISK |
|
OVERALL |
MEDIUM RISK |
MEDIUM RISK |
Summary of main issues
- The most recent quantitative stock assessment conducted for Sea Mullet was in 2005. The current assessments of stock status for the NSW and QLD components of the stock are limited to a weight of evidence approach based on catch, CPUE and age/size structure of the commercial catch;
- Considerable latency exists in the commercial harvesting sector across both jurisdictions and there are no well-defined harvest control rules in place to reduce exploitation as the point of recruitment impairment is approached;
- Dusky Flathead is an important target species in the mesh net sector and may be susceptible to localised depletion due to the limited movement of adults. Commercial catch and catch rates have declined substantially in recent years and the exploitation status is listed as uncertain.
- There has been limited monitoring of total catch composition in the fishery.
- Rates of ETP species interactions are thought to be low, although there is no mechanism to independently validate logbook reporting.
Outlook
Sea Mullet – Mesh net
| Component | Outlook | Comments |
| Target species | Improving | Significant reform processes are underway in both main jurisdictions harvesting the eastern Australian stock of Sea Mullet. In NSW, the Commercial Fisheries Business Adjustment Program will address excess fishing capacity by linking shares to catch or effort. In Queensland, a harvest strategy with well-defined harvest control rules will be developed by 2018 as part of the Queensland Government’s Queensland Sustainable Fisheries Strategy 2017-2027. |
| Environmental impact of fishing | Uncertain | The sector appears relatively well placed against habitat and ecosystem performance indicators. The exploitation status of Dusky Flathead is currently uncertain. |
| Management system | Improving | Reforms being implemented through the Commercial Fisheries Business Adjustment Program may lead to a reduction in some risk scoring. |
Sea Mullet – Haul net
| Component | Outlook | Comments |
| Target species | Improving | Significant reform processes are underway in both main jurisdictions harvesting the eastern Australian stock of Sea Mullet. In NSW, the Commercial Fisheries Business Adjustment Program will address excess fishing capacity by linking shares to catch or effort. In Queensland, a harvest strategy with well-defined harvest control rules will be developed by 2018 as part of the Queensland Government’s Queensland Sustainable Fisheries Strategy 2017-2027. |
| Environmental impact of fishing | Uncertain | The sector appears relatively well placed against habitat and ecosystem performance indicators. The exploitation status of Common Silverbiddy is uncertain. |
| Management system | Improving | Reforms being implemented through the Commercial Fisheries Business Adjustment Program may lead to a reduction in some risk scoring |
Complete Report
COMPONENT 1: Target fish stocks
1A: Stock Status
CRITERIA: (i)The stock is at a level which maintains high productivity and has a low probability of recruitment overfishing.
(a) Stock Status
| Sea Mullet |
MEDIUM RISK |
|
Extensive tagging studies suggest a single east coast biological stock of Sea Mullet, extending from central Queensland to eastern Victoria (Stewart et al, 2016).
The most recent quantitative assessment of the stock occurred in 2005, using data to 2002 (Bell et al. 2005). The assessment found that the stock has been heavily exploited since the fishery’s introduction more than 100 years ago, with recruitment highly variable. Point estimates of biomass at that time were uncertain but “clearly less than 60% of the virgin level”.
In recent years, both Queensland and NSW have assessed the stock using a ‘weight of evidence’ approach, based on catch, nominal catch rates and age and size composition of the commercial catch.
Stewart et al (2016) report that:
- “The Queensland component of the Eastern Australian biological stock has a long history of stable commercial landings. In 2015, 1982 t was reported landed, which is close to the long-term average of around 2000 t. Length frequency information from routine monitoring shows stable distributions of fish sizes harvested by the Queensland fishery. Age frequency information shows fish from three to five years old dominate catches, but older fish are present. Recruitment has been consistent, with evidence of recent strong year classes. The above evidence indicates that the biomass of the Queensland component of this stock is unlikely to be recruitment overfished.”;
- The New South Wales component of the Eastern Australian biological stock is assessed annually in terms of landings and catch rates (CPUE) in both the estuary and ocean fisheries. The annual spawning run fishery on ocean beaches is also assessed in terms of fish sizes and ages in landings. Commercial median catch rates have remained stable in the estuary fishery (kg per day of mesh netting) and increased slightly in the ocean fishery (kg per day of beach hauling) since the early 1980s. The size compositions of fish in ocean landings have remained stable, while the age compositions of fish in this fishery are generally between two and five years old, with some variations in year class strength. The above evidence indicates that the biomass of the New South Wales component of the stock is unlikely to be recruitment overfished.
On the basis of the above, it appears likely the stock is above the point of recruitment impairment (PRI). Nevertheless, given the age and uncertainty of the previous stock assessment there is limited evidence that the stock is currently fluctuating at or around a level consistent with MSY. Accordingly, the stock does not meet the low risk SG and we have scored this as medium risk.
PI SCORE – MEDIUM RISK
1B: Harvest Strategy
CRITERIA: (i) There is a robust and precautionary harvest strategy in place.
| (a) Harvest Strategy |
PRECAUTIONARY HIGH RISK |
The east coast stock of Sea Mullet is primarily shared and harvested in NSW and Queensland. In NSW, the stock is harvested in both the Estuary General Fishery (EGF) and the Ocean Haul Fishery (OHF). Catches in the EGF and OHF range generally between 1000-2000t per annum per fishery (Stewart, 2015a), while catches in the Queensland East Coast Inshore Finfish Fishery (ECIFFF) have a similar long-term average of around 2000 t per year. Recreational catch in both States is thought to be minimal in comparison to the commercial catch (e.g. Taylor et al, 2012; Webley et al, 2015). For this SI, the effectiveness of the harvest strategy is assessed across the stock as a whole.
In NSW, the harvest strategy for the EGF and the OHF primarily consists of 1) a limit on the number of fishers authorized to operate in the fisheries, 2) monitoring through logbooks, 3) temporal and spatial closures (approximately 70% of estuaries are open for fishing and many of these have additional closures within them, see http://www.dpi.nsw.gov.au/fisheries/info/closures/commercial/eg, also 50% of all beaches are closed to the OHF), 4) gear restrictions (i.e. mesh sizes and maximum net lengths) and 5) a minimum size limit of 30 cm. Recreational fishers are limited to both bag and size limits (20 Sea Mullet at 30 cm).
No well-defined harvest control rules exist, although the NSW Fishery Management Strategy (FMS) has a specific trigger point whereby if the exploitation status of a primary or key secondary species is changed to ‘overfished’ or ‘recruitment overfished’ by NSW DPI a recovery program must be implemented for the species.
Considerable latency has been identified in the EGF and OHF (typical rates between 40-90% latency in permits, depending on zone; Stevens et al, 2012), which would likely limit the capacity of the management to adjust exploitation flexibly in response to changes in stock status. In order to address latency and other issues, the NSW Government is implementing a Commercial Fisheries Business Adjustment Program (the BAP) to link shares to either catch or fishing effort, provide assistance to fishing business to adjust their operations and streamline current fishing controls that impact fishing efficiency. In the EGF this includes the introduction of a total allowable effort cap and individual transferable effort days issued to each region, allocated on shares held[1].
In the ECIFFF, harvest controls include a restriction on license numbers, as well as a complex series of area closures, gear limitations and size and possession limits. Access to different areas and net configurations dictated by fishery ‘symbols’ attached to commercial fishing boat licenses (FBL). In broad terms, a FBL is required to operate a nominated primary boat and tender boats for commercial fishing, while the symbols which attach to the license dictate the types of fish able to be caught, the gear able to be used, areas able to be fished and the like. The fishery symbols that account for the bulk of the Sea Mullet catch are the ocean beach fishery (K symbol), tunnel net symbol (N10), N1 symbol and N11 symbol. The ECIFFF has been subject to substantial rationalization of symbol numbers in the past decade, although there are still comparatively large numbers available. As at February 2017, there were 36 K symbols, 22 N10 symbols, 86 N1 symbols and 281 N11 symbols[2], each of which is able to harvest mullet (albeit N11 symbols are primarily for harvesting bait). In 2015, 248 licenses reported harvesting mullet (Stewart et al, 2016a). Catches have been roughly equally split between the ocean beach (K) fishery and the non-ocean beach sectors in recent years.
In Queensland, the stock has been subject to routine length frequency and age-at-catch monitoring since 1999[3]. No well-defined harvest control rules exist, although the stock was previously the subject of a trigger point in the ECIFFF Performance Measurement System (PMS) requiring a review if combined catches across both Queensland and NSW exceeded a specified level (3620t).
There is uncertainty in the information on the likely effectiveness of the current harvest strategy. Based on virtual population analysis, Bell et al (2005) recommended a combined TAC of 3620 t for the NSW and Queensland fisheries (assuming a F0.1 harvesting strategy), although with a very high degree of uncertainty (95%C.I. 2232t:71153t). The trigger point in the ECIFFF PMS to review catch levels is based on this figure. Combined catches across both jurisdictions have exceeded the recommended TAC in every year since 2006, peaking in 2010 at over 5,800t (Stewart et al, 2016a). In response to the breaching of the PMS trigger, DAFF (2014) concluded that “the Sea Mullet stock is shared with New South Wales where the bulk of the east coast Sea Mullet harvest is caught. Queensland catches are stable and within historical levels. Sea Mullet was recently assessed by New South Wales as ‘fully fished’ due to a long history of stable landings and catch rates for estuary and ocean fisheries in both jurisdictions. Sea Mullet is considered sustainably fished in Queensland. Given the harvest of Sea Mullet is already regularly monitored by both jurisdictions for unsustainable harvest signals, the triggering of this measure will not be investigated further.” Assessments against the PMS have reportedly been largely discontinued and will be superseded by other arrangements (e.g. formal harvest strategies) to be developed as part of a broader package of reforms for Queensland fisheries.
The harvest strategies for the EGF (and OHF) and Queensland ECIFFF are unlikely to be highly responsive to the state of the stock given the considerable effort latency and the absence of other overall controls on catch or effort. In the NSW fisheries, the respective Fishery Management Strategies for the EGF and OHF require action to be taken to limit exploitation only after a stock is classified as overfished. The best argument for the harvest strategy meeting the medium risk SG (i.e. that it will achieve the stock management objectives reflected in Performance Indicator 1A[i]) is that a number of indicators of abundance and recruitment (e.g. CPUE, length, age) are regularly monitored by both jurisdictions and to date have remained stable. Nevertheless, the substantial capacity for increases in effort on mullet given the combined latency in the NSW and Queensland fisheries means there is scope for catches to potentially exceed sustainable levels (particularly in the context of the recommended TAC of 3620 t, albeit highly uncertain) if effort is activated, such as in response to market forces. To that end, we have scored this SI precautionary high risk.
We note however that significant reform processes are currently underway in both jurisdictions which are likely to improve the position of the fishery against this SI in coming years.
[1] http://www.dpi.nsw.gov.au/fishing/commercial/reform/decisions
[2] fishnet.fisheries.qld.gov.au
[3] https://www.daf.qld.gov.au/fisheries/monitoring-our-fisheries/commercial-fisheries/species-specific-programs/monitoring-reporting/sea-mullet-biological-monitoring-update
(b) Shark-finning
NA
CRITERIA: (ii) There are well defined and effective harvest control rules (HCRs) and tools in place.
| (a) HCR Design and application |
PRECAUTIONARY HIGH RISK |
|
In NSW, the management strategy is assessed against the performance indicators (PI) in the FMS based on information from annual NSW DPI stock assessment workshops (e.g. DPI, 2016a). The main harvest PI in NSW for target species (develop a recovery plan if a species is assessed as overfished) is reactionary and does not serve to limit exploitation as PRI is approached. In Queensland, the best approximation of a harvest control rule is the PMS, which requires a management response to be developed within three months of the management agency becoming aware that a trigger has been exceeded (DEEDI, 2009). The existing PMS trigger is based on the TAC of 3620t recommended by Bell et al (2005), however assessments against the PMS have reportedly been largely discontinued and will be superseded by other arrangements (e.g. formal harvest strategies) to be developed as part of a broader package of reforms for Queensland fisheries. Notwithstanding that, a number of independent indicators of stock abundance (e.g. age/size structure of the commercial catch, CPUE) are actively monitored by both jurisdictions and have remained stable in recent years. Ongoing monitoring of these indicators is likely to be capable of detecting stock decline and could be used to justify reductions in exploitation if PRI was approached. Accordingly, we have scored this SI precautionary high risk.
We note that reform processes are underway in both jurisdictions which will likely improve the scoring of the stock against this SI. In NSW, the BAP will link shares to fishing effort, with the Structural Adjustment Review Committee (SARC) recommending the introduction of a total allowable effort cap and individual transferable effort days issued to each region of the EGF Mesh and Haul net sectors, and higher minimum shareholdings in the OHF General Purpose Hauling sector to reduce endorsement numbers. These initiatives should reduce latency and strengthen the effectiveness of tools available to adjust levels of exploitation where necessary. In Queensland, the Queensland Sustainable Fisheries Strategy 2017-2027 commits to the adoption of harvest strategies for all major fisheries by the end of 2020, with a priority to develop trawl, crab and inshore fisheries strategies by the end of 2018 (DAF, 2017). Harvest strategies will include well-defined harvest control rules and aim to maintain stocks at levels above MSY.
PI SCORE – PRECAUTIONARY HIGH RISK
1C: Information and Assessment
CRITERIA: (i) Relevant information is collected to support the harvest strategy.
| (a) Range of information | MEDIUM RISK | |
There is good information on the distribution and biology, including stock structure, for Sea Mullet (e.g. Stewart et al. 2016). Work on the population structure of Sea Mullet indicates that they comprise a single stock on the east coast of Australia. Fleet composition of the EGF, OHF and Qld ECIFFF is well understood and catch and effort information is provided in the form of daily logbooks. However, changes in reporting arrangements mean there is some uncertainty around whether these constitute a robust time series in NSW (Stewart, 2015a). Moreover, in Queensland only nominal cate appears to be monitored which may not be an accurate index of abundance. For the EGF, catch is reported by the licence endorsement, which enables determination of gear type. Unpublished data provided by NSW DPI from 2009/10 to 2013/14 indicated that the proportion of mullet harvested by haul net and mesh net in the EGF during this period was approximately 30% and 70%, respectively. Periodic recreational fishing surveys are also conducted that estimate Sea Mullet catch (e.g. Henry and Lyle 2004, Webley et al, 2015, West et al, 2016), and compared to the commercial catches the recreational harvest is quite low in both jurisdictions (<10t, Stewart, 2015a, Webley et al, 2015, West et al, 2016). Age and length frequency information is regularly collected from the commercial catch in both jurisdictions and is examined for concerning stock trends as part of regular weight of evidence based assessments (e.g. Stewart, 2015a; Stewart et al, 2016). However, the available information is not monitored in the context of a formal harvest control rule. While a range of information exists to support the harvest strategy, uncertainties in some components (e.g. in the NSW timeseries) mean it is not clear whether they are sufficient to support an effective HCR and harvest strategy. Accordingly, we have scored this SI medium risk.
| (b) Monitoring and comprehensiveness |
MEDIUM RISK |
Stock abundance is primarily monitored using catch and effort patterns in logbooks, supported by regular monitoring of age and size classes in the commercial catch[1]. The latter provides estimates of fishing mortality and magnitude and consistency of recruitment (Stewart et al, 2016). In Queensland, monitoring of effort and catch rate appears to be nominal only (rather than standardised) which may not be a reliable index of stock abundance (e.g. Harley et al, 2001). In NSW, catch and effort are collected by gear type, although changes in reporting arrangements over time mean that relative abundance may not be comparable throughout the time series. In particular, Stewart (2015a) reports that “in 2009/10 fishing effort reporting requirements changed substantially and relative catch rates before and after this time may not be directly comparable. Relative catch rates may not be robust indicators of abundance and caution should be applied when interpreting these results”. Recreational catch is monitored periodically (the last survey in NSW was undertaken in 2013/4 – West et al, 2016 – and before that in 2000; surveys in Queensland are undertaken every 2-3 years – e.g. Webley et al, 2015). While there is good information on all removals from the stock, abundance is not monitored consistent with a harvest control rule and there is some uncertainty around the robustness of abundance indices from commercial logbook information. Nevertheless, other indicators (age/length frequency) are monitored regularly, and together with information on catch and effort, allows assessments of stock status according to generic stock status categories (e.g. Stewart et al, 2016).
[1] See for example, https://www.daf.qld.gov.au/fisheries/monitoring-our-fisheries/commercial-fisheries/species-specific-programs/monitoring-reporting/sea-mullet-biological-monitoring-update
CRITERIA: (ii) There is an adequate assessment of the stock status.
| (a) Stock assessment |
MEDIUM RISK |
|
A stock assessment has been completed for the Qld/NSW mullet stock (Bell et al, 2005), but has not been updated. The current assessment of Sea Mullet in both NSW and Queensland uses a ‘weight of evidence’ approach and estimates stock status according to generic categories (e.g. ‘sustainable’, ‘overfished’; Stewart et al, 2016; Stewart, 2015a). A key information source is historical CPUE levels, however there is some uncertainty in the interpretation of long-term trends in NSW due to changes in reporting methods during 2009/10. Despite this limitation, annual trends in the periods before and after 2009/10 demonstrate stability in CPUE. Size and age structure data from the commercial catch are also gathered to monitor stock response to harvest and recruitment in both jurisdictions (e.g. Stewart, 2015a). In combination, these measures allow for assessment of status relative to generic reference points appropriate to the species category, consistent with medium risk.
| (b) Uncertainty and Peer review |
MEDIUM RISK |
|
The uncertainty of using CPUE data as an approximation of abundance is identified but not accounted for. The assessment has been peer reviewed internally in the annual stock status assessments (e.g. Stewart, 2015a) and every two years in the national stock status report (e.g. Stewart et al, 2016).
PI SCORE – MEDIUM RISK
COMPONENT 2: Environmental impact of fishing
2A: Other Species
CRITERIA: (i) The UoA aims to maintain other species above the point where recruitment would be impaired (PRI) and does not hinder recovery of other species if they are below the PRI.
(a) Main other species stock status
| Mesh Net | MEDIUM RISK | |
| Haul Net | PRECAUTIONARY HIGH RISK | |
Catch data from the EGF, reported by endorsement type, were provided by NSW DPI for 2009/10 to 2014/15. These data enabled determination of the composition of the retained catch for the haul net and mesh net sectors over this six-year period. Main other species are determined as those representing >5% of the commercial catch, or >2% if the species is deemed more susceptible to fishing. Table 2 and Table 3 below present the proportion of the catch of the retained target species (Sea Mullet) and main other species, for the mesh net and haul net sectors, respectively.
Table 2: Proportion of the catch for target (Sea Mullet) and main other species identified for the mesh net sector of the EGF from catches between 2009/10 to 2014/15.
| Species | %EGF Mesh net catch |
| Sea Mullet | 54.9% |
| Luderick | 13.8% |
| Yellowfin Bream | 8.1% |
| Dusky Flathead | 6.4% |
| Mulloway | 2.3% |
Table 3: Proportion of the catch for target (Sea Mullet) and main other species identified for the haul net sector of the EGF from catches between 2009/10 to 2014/15.
| Species | %EGF Haul net catch |
| Sea Mullet | 54.9% |
| Common Silverbiddy | 9.1% |
| Yellowfin Bream | 4.5% |
| Luderick | 4.5% |
Main other species for the mesh net sector were assessed as Luderick, Yellowfin Bream and Dusky Flathead. In the haul net sector, the only main other species >5% of the retained catch is Common Silverbiddy.
Although bycatch data are not recorded in logbooks, it is considered unlikely that any discarded species comprise more than 5% of the total catch. This assumption is consistent with previous onboard observer studies in this fishery (Stewart, 2008; Gray et al., 2003).
Luderick (mesh net) (Medium risk)
Luderick occurs from southern Queensland to northern Tasmania and South Australia and is assessed as a single eastern Australian biological stock (Hall et al, 2016). Although small catches are taken in other jurisdictions, around 95% of the commercial catch is taken in NSW. Gray et al. (2010) estimated fishing mortality between 0.5 and 0.6, which is at the high end for a relatively long-lived species.
However, they considered harvest levels appeared to be sustainable with newly mature fish between 3-7 years old comprising the bulk of the catch and good, consistent recruitment being detected in most estuaries surveyed (Gray et al. 2010). The latest stock status report (Hall, 2015a) provides CPUE data for Luderick that demonstrates relatively stable trends over time, with recent increases between 2009/10 and 2013/14. The size distribution of Luderick in NSW commercial landings also demonstrates stability over time, with a modal size several centimetres above the LML (Hall, 2015a). Hall (2015a) lists Luderick as ‘fully fished’, while Hall et al (2016) conclude that the central part of the stock in New South Wales is unlikely to be recruitment overfished and the current level of fishing pressure is unlikely to cause the stock to become recruitment overfished. Accordingly, it is at least likely that the stock is above PRI.
Dusky Flathead (mesh net) (Medium risk)
The biological stock structure of Dusky Flathead populations is unknown. In the absence of information on biological stock boundaries, assessments of stock status are presented at the jurisdictional level (McGilvray et al (2016a). In NSW, almost all Dusky Flathead taken commercially are harvested in the EGF. Recent studies suggest that the species demonstrates limited movements and may be vulnerable to localised depletion within estuary systems (Gray and Barnes, 2015).
McGilvray et al (2016a) conclude that the available evidence indicates that the biomass of Dusky Flathead in NSW is not considered to be recruitment overfished, however no current estimates of fishing and natural mortality are available and there is insufficient information available to confidently classify whether overfishing may be occurring. Overall, they classify the stock as ‘undefined’. This is consistent with Hall (2015b) who listed exploitation status as ‘uncertain’. In particular, they note conflicting signals exist between recent declines in commercial catches, catch rates and high fishing mortality estimates on the one hand and relatively stable length frequencies in the commercial catch on the other.
On the basis of McGilvray et al (2016a) conclusion that the stock is unlikely to be recruitment overfished, the stock appears to meet the medium risk SG. Nevertheless, we note the concerning trend in commercial relative catch rate which should be closely examined in future assessments.
Yellowfin Bream (mesh net) (Low risk)
McGilvray et al (2016b) report that “the stock structure of Yellowfin Bream has been examined through tagging studies and genetic investigations. Two tagging studies—one in New South Wales and one in Queensland—have suggested the possibility of separate populations, based on a lack of significant movements between estuaries. However, a genetic investigation has shown that this species forms a single east coast population, with a general northward dispersal of adults and a southward dispersal of larvae.”
Between 200 and 700 t of Yellowfin Bream has been caught annually in NSW since 1944 (Stewart, 2015b), accounting for around two thirds of the total catch for the stock. Catches have generally ranged from 200-400 t in all years except between 1980 and 1997 when catches ranged from 400-700 t. Trends in commercial CPUE since 1983/84 reflect this long-term stability, albeit that changes in reporting arrangements on two occasions mean that CPUE trends must be interpreted in 3 blocks of years (1984/85 to 1996/97, 1997/98 to 2008/09 and 2009/10 to 2013/14). Length composition of the landings for this species has been relatively stable since the 1950s (McGilvray et al, 2016b).
Similar trends of long term stable catches, CPUE and size structure are also reported for the Queensland sector harvesting from this stock (QDAFF 2014). Given the long term stable catches, catch rates, and size structure of the catch, it is probably highly likely that the stock is above the point where recruitment is being impaired.
Common Silverbiddy (haul net) (Precautionary high risk)
Hall (2015c) reports that the Common Silverbiddy (Gerres subfasciatus) is widely distributed, occurring on both the east and west coasts of Australia. Along the NSW coastline, it is found in inshore waters and estuaries, generally over sand and mud substrates. The stock structure and movement patterns of the species in NSW waters and across its species distribution is unknown.
Common Silverbiddy are caught predominately as bycatch of the EGF. Demand for the species increased around 1980 with peak catches of almost 200 t in the mid-1990s (Figure 1a). While EGF catches were below 100 t from 2001/02 to 2007/08, they increased consecutively to around 150 t in 2010/11 and declined rapidly thereafter. The recent declines in catches have been mirrored in magnitude by declines in relative CPUE (Figure 1b), however effort reporting changed in 2008 so that CPUE trends must be interpreted carefully.
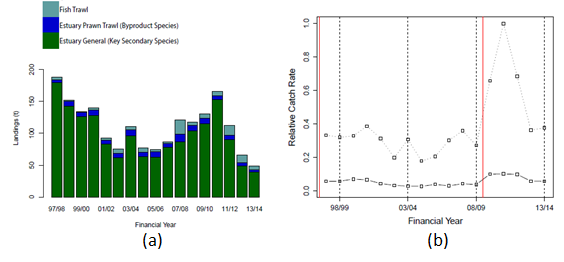
Figure 1: (a) Total catch by commercial fishery and (b) relative CPUE of Common Silverbiddy from 1997/98 to 2013/14. Two indicators are provided: (1) median catch rate (lower solid line); and (2) 90th percentile of the catch rate (upper dashed line). The red lines indicate years when reporting requirements changed. In 2009/10 fishing effort reporting requirements changed substantially and relative catch rates before and after this time may not be directly comparable. (Source Hall, 2015c)
Hall (2015c) concludes that the exploitation status of the stock is ‘uncertain’ based on large unexplained declines in the commercial landings and catch rates over the last 3 years. While the recent declines in both catch and CPUE are concerning, it is noted that both catch and CPUE declined in the early 2000s (albeit less dramatically) before increasing again towards the end of that decade. Hall (2015c) also notes that declines have largely occurred in specific estuaries and that biological data have been collected during an independent survey of several NSW estuaries and will be further analysed to investigate current declines in landings and catch rates.
The status of Common Silverbiddy in relation to PRI is not known and there is uncertainty as to whether overfishing is occurring. While the low inherent vulnerability and high resilience of the species (Froese and Pauly, 2017) suggests that the measures in place in the fishery (in particular, the large amount of closed area) could be expected to ensure the UoA does not hinder recovery across the NSW management jurisdiction as a whole, this is currently uncertain. Accordingly, we have scored this SI precautionary high risk. We note that that biological data have been collected during an independent survey of several NSW estuaries and were scheduled to be further analysed to investigate current declines in landings and catch rates (Hall, 2015c). Any outcomes from this work should be taken into account in future assessments.
CRITERIA: (ii) There is a strategy in place that is designed to maintain or to not hinder rebuilding of other species.
(a) Management strategy in place
| Mesh net |
PRECAUTIONARY HIGH RISK |
|
| Haul net |
PRECAUTIONARY HIGH RISK |
|
Harvest limitation is primarily achieved through a limit on the number of fishers authorised to operate in the fishery (notwithstanding considerable latency), temporal and spatial closures (approximately 70% of estuaries are open for fishing and many of these have additional closures within them), gear restrictions (i.e. mesh sizes and net lengths) and minimum size limits.
Additionally, there are specific PIs with associated trigger points in the FMS to limit target, byproduct and bycatch harvest/interactions. For example:
- if the exploitation status of a target species is changed to ‘overfished’ or ‘recruitment overfished’ by NSW DPI a recovery program must be implemented for the species;
- If any bycatch or non-target byproduct species exceeds 15% of the total catch in two consecutive years a management response is required.
- For retained species, if catch or catch rate reference points (upper or lower) are triggered then a review of the circumstances causing the trigger is undertaken.
For the mesh net sector, these measures appear to be sufficient to ensure Luderick and Yellowfin Bream remain above PRI. For Dusky Flathead, almost all of the NSW commercial catch is taken in the EGF. Both McGilvray et al (2016a) and Hall (2015b) conclude that there is uncertainty about whether current levels of exploitation will ensure the stock does not become recruitment overfished, with both commercial catch and catch rate declining in recent years under current management arrangements. A minimum legal size limit of 36cm is in place, but does little to protect females which reach maturity at 55-57cm (Hall, 2015b). On its own, this stock would receive a precautionary high risk score against this SI. Accordingly, we have scored the SI precautionary high risk overall for the mesh net UoA.
For the haul net sector, Common Silverbiddy is taken as a byproduct species and is listed as a key secondary species under the FMS. As a key secondary species catches are monitored against reference levels designed to detect undesirable trends. Substantial declines in commercial catch and CPUE have occurred over the period 2010-11 to 2013-14, possibly reflective of declines in abundance. These unexplained declines resulted in the exploitation status of the stock being classified as ‘uncertain’ in the most recent three NSW stock status assessment reports (e.g. Hall, 2015c; NSW DPI, 2017a). As a key secondary species, action to recover the stock is required only after being classified as ‘overfished’. Hall (2015c) reports that biological data have been collected during an independent survey of several NSW estuaries and will be further analysed to investigate current declines in landings and catch rates. Accordingly, at this stage it appears unclear whether existing management arrangements are sufficient to ensure the fishery does not hinder recovery and we have scored this SI precautionary high risk.
(b) Management strategy evaluation
| Mesh net |
PRECAUTIONARY HIGH RISK |
|
| Haul net |
PRECAUTIONARY HIGH RISK |
|
For the mesh net sector, there are no current estimates of fishing and natural mortality available for Dusky Flathead (McGilvray et al, 2016a) and exploitation status is uncertain. Accordingly, it is unclear whether the current measures in place are likely to work. Given the stock is currently likely to be above the PRI, we have scored this SI precautionary high risk.
For the haul net sector, a similar situation exists, with unexplained declines in the commercial catch and catch rates in recent years for Common Silverbiddy. It is also not clear if existing management arrangements are likely to work and we have scored this SI precautionary high risk.
| (c) Shark-finning | ||
CRITERIA: (iii) Information on the nature and amount of other species taken is adequate to determine the risk posed by the UoA and the effectiveness of the strategy to manage other species.
(a) Information
| Mesh net |
MEDIUM RISK |
|
| Haul net |
MEDIUM RISK |
|
For both the mesh net and haul net sectors, information on retained species catch and effort is collected through compulsory catch and effort logbooks[1]. Information on daily catch and effort is collected, with logbooks submitted monthly. Length and age frequency information is also collected for some commercially important species. Weight of evidence based assessments of all main other species identified here are undertaken annually (e.g. Stewart et al, 2015; NSW DPI, 2017a).
A key overall weakness in both sectors is the absence of ongoing bycatch species monitoring although some quantitative information is available indicating that bycatch is likely to be minimal (Stewart, 2008; Gray et al., 2003).
For the main other species in the mesh net sector, available quantitative information has been sufficient to assign an ‘exploitation status’ according to the assessment framework outlined in Scandol (2004) for both Luderick and Yellowfin Bream. Estimates of fishing mortality (F) and natural mortality (M) exist for both species (Hall et al, 2015a; Stewart, 2015b). This information is likely to be sufficient to detect increases in risk and to support at least a partial strategy to manage the impact of the fishery, although both stocks would be better positioned with a standardised measure of effort and catch rate. For Dusky Flathead, no current estimates of F or M exist, and only nominal catch rate is monitored (McGilvray et al, 2016a). The available information has been inadequate to allow the exploitation status of the stock to be confidently classified under either the NSW (Hall, 2015b; NSW DPI, 2017a) or Status Key Australian Fish Stocks (McGilvray et al, 2016a) frameworks, although this is largely because of conflicting signals in available quantitative information. McGilvray et al (2016) suggested the available evidence indicated the stock was not likely to be recruitment overfished.
For the haul net sector, some quantitative information including catch and catch rate is available for Common Silverbiddy, although changes in reporting arrangements mean that relative catch rates may not be robust indicators of abundance (Hall, 2015c). While the existing quantitative information was inadequate to confidently assign an exploitation status for this species in recent assessments (Hall, 2015c; NSW DPI, 2017a), some quantitative and qualitative information is available to support management measures and new biological information has been collected.
Overall, we have scored both UoAs medium risk on the basis that some quantitative and qualitative information exists to assess the impact of the UoA with respect to status and to support management measures, although there are weaknesses in some data components (e.g. catch rate time series) and only qualitative information is available in recent years on bycatch.
[1] https://www.dpi.nsw.gov.au/__data/assets/pdf_file/0008/753146/New-South-Wales-Department-of-Primary-Industries-Catch-and-Effort-Logbook.pdf
PI SCORE -PRECAUTIONARY HIGH RISK – Mesh net, Haul net
2B: Endangered Threatened and/or Protected (ETP) Species
CRITERIA: (i) The UoA meets national and international requirements for protection of ETP species.
The UoA does not hinder recovery of ETP species.
|
(a) Effects of the UoA on populations/stocks |
MEDIUM RISK |
Because of the limited area of operation, targeted fishing gear and specific habitat fished in the EGF, ETP interactions are reportedly very rare. Gray et al (2003) undertook a scientific observer program in the NSW estuarine gillnet fishery targeting Sea Mullet and Luderick and sampled 265 fishing trips across six estuaries distributed throughout the NSW coast and three fishing periods throughout 2001. A total of 58 species were reported including 53 finfish, three invertebrates, 1 bird (Cormorant, Phalacrocorax spp.), and 1 tortoise (Short-neck tortoise, Emydura macquarii). A single individual of each of the bird and turtle species was taken. The authors noted that although dolphins do occur, and were observed, in estuaries during the study, no captures were recorded in nets, indicating that the estuarine gillnet fishery does not pose a direct threat to populations of these species.
Although the gear is likely to be slightly different to the mesh and haul nets assessed here, a separate observer study of seine netting targeting Eastern Sea Garfish in the EGF across two fishing seasons in 2005 and 2006 reported no harmful interactions with ETP species (Stewart, 2008).
Notwithstanding data uncertainties, the EGF Environmental Impact Statement concluded that the fishery will not have a significant effect on any threatened species, populations or ecological communities or their habitats (NSW Fisheries, 2001).
Reporting of ETP interactions by the EGF was made mandatory in 2005. In the haul sector, in the period between 2012 and 2016, interactions with a total of 30 Green Turtles were reported, with all reportedly released alive (NSW DPI, 2017b). NSW DPI (2017b) reports that all reported interactions were made by the same fisher operating in a specific area of a specific estuary. This, together with the outcomes of short term observer studies (e.g. Gray et al, 2003), indicates that some level of under-reporting of interactions may be occurring in the fishery as a whole. In the mesh net sector, between 2012 and 2016, one Great Hammerhead Shark (discarded dead) and one Black Rockcod (unknown fate) were reported (NSW DPI, 2017b).
While the historical observer studies provide some evidence that ETP species interactions are likely to be very low and are therefore not likely to hinder recovery, additional measures to verify commercial fisher reporting would be required to conclude this with higher confidence. Accordingly, we have scored this SI medium risk.
CRITERIA: (ii) The UoA has in place precautionary management strategies designed to:
- meet national and international requirements; and
- ensure the UoA does not hinder recovery of ETP species.
| (a) Management strategy in place |
MEDIUM RISK |
|
The measures which serve to limit interactions with ETP species are largely the same as the input controls introduced for the management of target species (e.g. limited entry, gear restrictions, spatial and temporal closures). Under the Fisheries Management Act the take of ETP species by commercial fishers is prohibited and reporting of interactions with ETP species was made mandatory in 2005. The FMS also has a specific PI with a trigger for management action if there are any observations by commercial fishers or observers that are likely to threaten the survival of ETP species. Given the likely low levels of interaction, these measures could be expected to ensure the UoAs do not hinder recovery of ETP species. Nevertheless, the main weakness is the absence of recent information verifying low rates of interaction and/or mechanisms to verify commercial fisher reporting. Accordingly, we have scored this SI medium risk.
| (b) Management strategy implementation |
MEDIUM RISK |
Apart from the Gray et al (2003) study undertaken over a decade ago, there is limited recent information on rates of interaction in the fishery. Based on the Gray et al (2003) and Stewart (2008) studies, the measures in place could be considered likely to work, although there is little recent evidence to provide an objective basis for confidence.
CRITERIA: (iii) Relevant information is collected to support the management of UoA impacts on ETP species, including:
- information for the development of the management strategy;
- information to assess the effectiveness of the management strategy; and
- information to determine the outcome status of ETP species.
| (a) Information |
MEDIUM RISK |
|
The level of ETP interaction is primarily monitored through mandatory reporting in commercial logbooks for the EGF, although there is no current mechanism to validate or cross-check reporting. A number of independent studies have opportunistically documented very low rates of interaction in some sectors (e.g. Gray et al., 2003; Stewart, 2008). While some ETP interactions have been reported in logbooks, interactions recorded in previous observer studies (albeit at very low rates) leave open the possibility that some level of under-reporting is occurring. Accordingly, while some quantitative information exists and is sufficient to support measures to manage ETP impacts, it is not clear that it is sufficient to assess total rates of fishery-related mortality.
PI SCORE – MEDIUM RISK
2C: Habitats
CRITERIA: (i) The UoA does not cause serious or irreversible harm to habitat structure and function, considered on the basis of the area(s) covered by the governance body(s) responsible for fisheries management
| (a) Habitat status | LOW RISK | |
The only mobile gear used in the EGF that makes any substantial contact with benthic habitats is the haul nets to target fish and prawns. The EIS for the EGF identified seagrass as the main habitat that could be impacted by the haul nets in the fishery (Otway and Macbeth 1999; NSW DPI, 2001). Observer studies in the EGF have suggested that the haul gear is mainly used over bare substrate (Gray et al. 2003, Stewart 2008). In a study of the effects of hauling on Zostera capricorni, in nine NSW estuaries, Otway and Macbeth (1999) reported that hauling may have caused a reduction in leaf length, but there were also increases in shoot and leaf densities. They concluded that any impact on fish and invertebrate recruitment, whilst not directly tested, was unlikely to be major (Otway and Macbeth, 1999). Given this information and the fact that significant amounts of seagrass are closed to fishing within the EGF area, it is probably highly likely that the fishery is not causing irreversible harm to habitat structure and function.
CRITERIA: (ii) There is a strategy in place that is designed to ensure the UoA does not pose a risk of serious or irreversible harm to the habitats.
| (a) Management strategy in place |
LOW RISK |
|
The main measures limiting habitat interaction include a limit on the number of licences authorised to operate in the fishery and gear and operational restrictions (i.e mesh net lengths and haul net length limits). In addition, there are substantial temporal and spatial closures under both fisheries and State marine parks legislation, with approximately 70% of estuaries open for fishing[1]. Of the estuaries available to the EGF, over 50% of the have closures within seagrass beds. Under State marine parks legislation, six multiple user marine parks have been established covering around one third of coastal waters in NSW[2]. Zoning plans for each marine park restrict mesh and haul netting from Sanctuary and Habitat Protection Zones (pink and yellow zones below) (Figure 3).
[1] http://www.dpi.nsw.gov.au/fisheries/info/closures/commercial/eg
[2] http://www.dpi.nsw.gov.au/fishing/marine-protected-areas
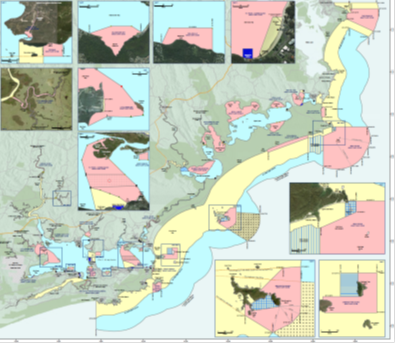
Figure 4: Port Stephens-Great Lakes Marine Park Zoning Map (Source: NSW DPI)
Additionally, the Policy and guidelines for fish habitat conservation and management states that an abatement plan must be developed for any threatening processes (including commercial fishing) to key habitat types such as seagrass[1]. Given the relatively benign nature of the gear, these measures are likely to achieve the objectives in 2C(i).
[1] http://www.dpi.nsw.gov.au/__data/assets/pdf_file/0009/468927/Policy-and-guidelines-for-fish-habitat.pdf
(b) Management strategy implementation
| (b) Management strategy implementation |
LOW RISK |
There is an objective basis for confidence that the management strategy will work based on the type and operational limitations of the mesh net and haul gear used, the substantial amount of habitat that is closed to fishing and studies’ suggesting that the haul gear used has minimal interaction with the habitat when it does (Otway and Macbeth 1999, Knuckey et al. 2002).
CRITERIA: (iii) Information is adequate to determine the risk posed to the habitat by the UoA and the effectiveness of the strategy to manage impacts on the habitat.
| (a) Information quality |
LOW RISK |
|
The types and distribution of the main habitats for NSW estuaries have been well documented (Creese et al. 2009). The vulnerability of these habitats and the impact of EGF operations have been identified in the EIS (NSW Fisheries, 2001) and targeted research studies (e.g. Otway and Macbeth, 1999).
(b) Information and monitoring adequacy
| (b) Information and monitoring adequacy |
LOW RISK |
Information is adequate to broadly understand the nature of the main impacts of gear use on the main habitats, including spatial overlap of habitat with fishing gear (e.g. NSW DPI, 2001). The physical impacts of hauling, which is assumed to be the most interactive gear with habitats, has only been studied on seagrass (Otway and Macbeth 1999) and not on unvegetated substrate where most of the fishing activity occurs. Nevertheless, while the level of habitat interaction hasn’t been quantified for the EGF, given that there are a substantial number of estuaries closed and there are additional seagrass closures in open estuaries, the level of interaction with habitats is likely to be low.
PI SCORE – LOW RISK
2D: Ecosystems
CRITERIA: (i) The UoA does not cause serious or irreversible harm to the key elements of ecosystem structure and function.
| (a) Ecosystem Status |
LOW RISK |
|
Serious or irreversible harm in the ecosystem context should be interpreted in relation to the capacity of the ecosystem to deliver ecosystem services (MSC, 2014). Examples include trophic cascades, severely truncated size composition of the ecological community, gross changes in species diversity of the ecological community, or changes in genetic diversity of species caused by selective fishing.Mesh nets and haul nets are non-selective gear types that target primarily fish and crabs. In the EIS it is recognised that there is the possibility that virtually all elements of the estuarine trophic structure may be impacted by the EGF (NSW Fisheries, 2001). However, a monitoring program examining the risk of all potential stressors on NSW estuaries (Roper et al. 2011) found that all elements of fishing had a low impact on algae (phytoplankton and macroalgae), vascular plants and fish. Taken together the three assemblages represent important aspects of an estuarine ecosystem’s function (phytoplankton biomass), structure (aquatic habitat extent) and composition (fish and macrophyte species). Overall, the EGF EIS concluded that “the risks of significant or irreversible trophic effects is low for most elements of the estuarine biota, the most likely exceptions being some of the sea birds. Even where localised effects do occur, the dispersed nature of fishing effort within the EGF needs to be considered from which we might conclude wide scale impacts are very unlikely” (NSW DPI, 2001). This evidence combined suggests the EGF is highly unlikely to be impacting ecosystem structure and function.
CRITERIA: (ii) There are measures in place to ensure the UoA does not pose a risk of serious or irreversible harm to ecosystem structure and function.
| (a) Management strategy in place |
LOW RISK |
|
Limiting ecological impact by the EGF is primarily achieved through a limit on the number of fishers authorised to operate in the fishery, temporal and spatial closures (fisheries and marine parks), gear restrictions and minimum size limits.
Additionally, there are specific PIs with associated trigger points in the FMS to limit the harvest of target and non-target species e.g.:
- if the exploitation status of a target species (all of these species are target species in the FMS) is changed to ‘overfished’ or ‘recruitment overfished’ by NSW DPI a recovery program must be implemented for the species (e.g. Mulloway);
- if any bycatch or non-target byproduct species exceeds 15% of the total catch in two consecutive years a management response is required.
Together with independent research on the ecosystem impacts on NSW estuaries (e.g. Roper et al, 2011), these measures are likely to constitute at least a partial strategy to ensure the UoA does not cause serious or irreversible harm to the key elements of ecosystem structure and function.
| (b) Management strategy implementation |
LOW RISK |
|
The findings of Roper et al (2011) provides some objective basis for confidence that the strategy will work.
CRITERIA: (iii) There is adequate knowledge of the impacts of the UoA on the ecosystem.
| (a) Information quality |
MEDIUM RISK |
|
There has been a substantial body of research conducted on the fish and invertebrate communities in NSW and how they interact with their habitats (e.g. Roy et al. 2001, Pease 1999). There has also been a review of this information to assess the status of NSW estuaries in the Status of the Catchment Report (SCR, Roper et al. 2011). This information is adequate to identify the key elements of the ecosystem. Nevertheless, the relatively limited information on catch composition (including discards) and limited observer coverage to provide independent verification of ETP interactions etc mean there may not sufficient information to detect increased risk to some ecosystem elements.
| (b) Investigations of UoA impact |
LOW RISK |
|
The main interactions of the EGF on these key ecosystem components can be inferred from existing information on species removals and the high level of knowledge of the trophic interactions in the estuarine environment (e.g. Burchmore et al. 1984, MacFarlane and Booth 2001). Additionally, fishing activity impacts on the estuarine ecosystems of NSW has been investigated in detail (Roper et al. 2011).
PI SCORE – LOW RISK
COMPONENT 3: Management system
3A: Governance and Policy
CRITERIA: (i) The management system exists within an appropriate and effective legal and/or customary framework which ensures that it:
- Is capable of delivering sustainability in the UoA(s); and
- Observes the legal rights created explicitly or established by custom of people dependent on fishing for food or livelihood.
| (a) Compatibility of laws or standards with effective management |
LOW RISK |
|
The EGF is managed under the Fishery Management Act 1994 (Act) and regulations made under this Act. NSW DPI is the State Government agency responsible for the administration of the Act.
The Act seeks to provide for ecologically sustainable development for the fisheries of NSW, through the achievement of its stated objectives, which are to conserve, develop and share the State’s fisheries resources for the benefit of present and future generations. The Act is aimed at achieving sustainable fisheries in accordance with Components 1 and 2.
| (b) Respect for Rights |
LOW RISK |
|
In recognition of Aboriginal peoples’ cultural fishing needs and traditions, several significant Act amendments commenced in early 2010. They included:
- Extending the objects of the Act to now explicitly recognise the connection Aboriginal people have with fisheries resources;
- The addition of a definition of Aboriginal Cultural Fishing to enable Aboriginal people to take fish or marine vegetation for cultural fishing purposes;
- The establishment of the Aboriginal Fishing Advisory Council (section 229) to ensure that Aboriginal people play a part in future management of the fisheries resource;
- Specific provisions under Section 37(c1) of the Act for issuing authorities for cultural events where fishing activities are not consistent with current regulation. This provision caters for larger cultural gatherings and ceremonies.
Aboriginal persons becoming exempt from paying a recreational fishing fee under 34C of the Act.
CRITERIA: (ii) The management system has effective consultation processes that are open to interested and affected parties. The roles and responsibilities of organisations and individuals who are involved in the management process are clear and understood by all relevant parties.
| (a) Roles and Responsibilities |
LOW RISK |
|
The Organisations and individuals involved in the management process have been identified. Functions, roles and responsibilities are explicitly defined and well understood for key areas of responsibility and interaction. The Minister responsible for administering the Fishery Management Act 1994 is ultimately responsible for the management of NSW commercial fisheries. The NSW DPI undertake day to day management of the EGF and act as a primary advisor to the Minister. Other groups may also provide advice to the Minister or through the DPI, including the Ministerial Fisheries Advisory Council (MFAC), the Commercial Fishing NSW Advisory Council and the NSW Total Allowable Catch Setting and Review (TAC) Committee. For more information see:
http://www.dpi.nsw.gov.au/fisheries/commercial/consultation
| (b) Consultation Process |
LOW RISK |
|
New consultation arrangements were introduced in November 2012 following an Independent Review of NSW Commercial Fisheries Policy, Management and Administration. In addition to the Deputy Director General DPI Fisheries, who acts as the primary advisor to the Minister, key groups involved in the consultation process include:
- Ministerial Fisheries Advisory Council (MFAC) – established to provide cross-sectoral advice on strategic policy issues to the Minister for Primary Industries. It includes representatives from the commercial, recreational, indigenous, aquaculture and conservation sectors and has an independent chair;
- Commercial Fishing NSW Advisory Council – the council is the key advisory body providing ongoing expert advice to Government on matters relevant to the sector; and
- NSW Total Allowable Catch Setting and Review (TAC) Committee – The TAC Committee is a statutory body established under the provisions of the Fisheries Management Act 1994 (the Act). It is required to determine and keep under review total allowable catch (or fishing effort) levels, as required. It gives effect to the objects of the Act having regard to all relevant scientific, industry, community, social and economic factors. Membership of the TAC Committee includes an independent Chairperson, a natural resource economist, a fisheries scientist and a person with appropriate fisheries management qualifications.
Task based and time-limited working groups may also be formed on an as needs basis to provide expert advice on specific issues. Working group members are appointed by the Deputy Director General, DPI Fisheries based on skill and expertise relevant to the tasks assigned to the working group. Current working groups include a Baitfish Working Group and a NSW Lobster Industry Working Group.
Where substantive changes are proposed to management arrangements, public consultations occurs through the release of a Regulatory Impact Statement (RIS) which sets out the proposed changes, likely impacts and alternative options considered.
Accordingly, the management system has processes in place to regularly seek and accept information from interested parties.
For more information on the full process see: http://www.dpi.nsw.gov.au/fisheries/commercial/consultation
CRITERIA: (iii) The management policy has clear long-term objectives to guide decision making that are consistent with MSC fisheries standard, and incorporates the precautionary approach.
| (a) Objectives |
LOW RISK |
|
The objectives of the Act include:
a) to conserve fish stocks and key fish habitats, and
b) to conserve threatened species, populations and ecological communities of fish and marine vegetation, and
c) to promote ecological sustainable development, including the conservation of biological diversity,and, consistently with those objectives:
d) to promote viable commercial fishing and aquaculture industries, and
e) to promote quality recreational fishing opportunities, and
f) to appropriately share fisheries resources between the users of those resources, and
g) to provide social and economic benefits for the wider community of New South Wales.
These objectives provide clear and explicit long term guidance to decision making consistent with Components 1 and 2.
PI SCORE – LOW RISK
3B: Fishery Specific Management System
CRITERIA: (i) The fishery specific management system has clear, specific objectives designed to achieve the outcomes expressed by Components 1 and 2.
| (a) Objectives |
MEDIUM RISK |
|
The EGF FMS has the following objectives for the fishery:
- To manage the EGF in a manner that promotes the conservation of biological diversity in the estuarine environment
- To maintain fish populations harvested by the EGF at biologically sustainable levels
- To promote the conservation of threatened species, populations and ecological communities associated with the operation of the EGF
- To appropriately share the resource and carry out fishing in a manner that minimizes social impacts
- To promote a viable commercial fishery (consistent with ecological sustainability)
- To ensure cost-effective and efficient EGF management and compliance programs
- To improve knowledge of the EGF and the resources upon which the fishery relies.
Additional fishery specific objectives and associated performance indicators and trigger points are set out in the Fisheries Management (Estuary General Share Management Plan) Regulation 2006 (the ‘SMP’).
While these objectives are consistent with the outcomes expressed by Components 1 and 2, the main uncertainty is the extent to which the objectives as set out in the FMS and SMP actively guide management of the EGF given the age of the documents and the extent to which they have been superseded by other management initiatives (e.g. the BAP). We have scored this SI medium risk on the basis that objectives consistent with Components 1 and 2 are at least implicit within the management system, although we note that confidence in the scoring would be strengthened with additional evidence that the objectives in the FMS continue to be actively used.
CRITERIA: (ii)The fishery specific management system includes effective decision making processes that result in measures and strategies to achieve the objectives.
| (b) Decision making |
MEDIUM RISK |
|
Under the NSW State Government’s fisheries decision-making process, the Fisheries Minister has ultimate responsibility for the management of the fishery and is empowered to make changes to the Fisheries Regulations and Management Plan. The Minister is advised by the NSW DPI and MFAC who, in turn, seek input from stakeholders and technical working groups.
The extent to which the management system could demonstrate that it has responded over time to serious and other important issues identified in relevant research, monitoring and evaluation in a timely, transparent and adaptive manner appears variable. There is evidence that the system process has responded to some serious issues by developing recovery plans for Mulloway (Silberschneider et al. 2009; currently overfished) and Eastern Sea Garfish (Stewart et al. 2005; historically overfished) that have provided management responses designed to limit harvest on these species. Nevertheless, the evidence that the management system responds to other important issues identified by research and monitoring is less clear.
| b) Use of the Precautionary approach |
MEDIUM RISK |
The use of the precautionary approach is required under the Act and is also addressed, in part, in Objective 7 in the FMS: to improve knowledge of the Estuary General Fishery and the resources upon which the fishery relies. Examples of precautionary approach exists in some, but not all, areas of management. For example, the high number of closure areas implemented over seagrass habitat to limit potential impacts on juvenile fish species that inhabit these areas appears precautionary, however the existence of substantial excess harvesting capacity across many EGF endorsement types and the requirement in the FMS that action be taken only after a stock is declared overfished does not. Moreover, the exploitation status of some important EGF species has been listed as uncertain for a number of years, at least partially as a result of concerning stock trends (e.g. Dusky Flathead), although the management response is not obvious from public information.
To that end, although fishery decisions appear to be made based on the best available information, it is not clear the low risk SG is met.
| (c) Accountability and Transparency |
LOW RISK |
|
Information on the fishery’s performance is available on the NSW DPI website, primarily through public reports of performance against the FMA trigger points (e.g. DPI, 2016a), stock status assessments (e.g. Stewart et al, 2015, DPI, 2017a) and periodic reviews against the Guidelines for the Ecologically Sustainable Management of Fisheries by the Commonwealth environment department (e.g. NSW DPI, 2013). Research reports relevant to the fishery are also available through the NSW DPI website (e.g. West et al, 2016) and websites of external funders (e.g. the Commonwealth Fisheries Research and Development Corporation). The findings of relevant research are discussed through the consultative structure described under 3A(ii)(b) above, and explanations are provided for any management actions or lack of action. Where significant management changes are required, a RIS is released calling for public comment. The RIS provides an explanation of the background to the proposed changes and alternative options considered.
CRITERIA: (iii) Monitoring, control and surveillance mechanisms ensure the management measures in the fishery are enforced and complied with.
| (a) MCS Implementation |
LOW RISK |
|
The NSW fisheries compliance program is led by the NSW DPI Fisheries Compliance Unit (FCU), which is focused on optimising compliance with the Act, the Marine Estate Management Act 2014 and their associated regulations. The FCU is separated into seven geographic compliance zones, with a State-wide Operations and Investigations Group that undertakes major/complex investigations, and the Conservation and Aquaculture Group that provides specialist capabilities in aquatic habitat compliance management. NSW DPI Fisheries Compliance Plans are regularly reviewed for progress against the objectives of the Australian Fisheries National Compliance Strategy (AFNCS).
MCS in the EGF primarily comprises commercial logbooks, at sea and land-based fisheries inspections of all sectors by the DPI Fisheries Officers, clear sanctions set out in legislation enforceable through the courts and promotion of voluntary compliance through education. Additionally, there is a specific PI in the FMS; facilitate effective and efficient compliance, research and management of the EGF with a trigger point of a compliance rate of less than 85% from all inspections. This PI is assessed in WTO submissions. Priorities for the MCS system are set using Risk Based Compliance principles set out by NSW Department of Premier & Cabinet and the plans that are produced internally and reviewed quarterly.
Significant prosecutions and rates of compliance are publicly reported on the NSW DPI website[1]. The compliance system appears to have an ability to enforce relevant management measures and rules.
[1] http://www.dpi.nsw.gov.au/fishing/compliance/fisheries-compliance-enforcement
| (b) Sanctions and Compliance |
MEDIUM RISK |
|
Sanctions to deal with non-compliance are outlined in the NSW Fisheries Compliance Enforcement Policy and Procedure document which specifically stipulates that sanction for non-compliance are consistently applied. Sanctions are publicly reported annually through the DPI website (http://www.dpi.nsw.gov.au/fishing/compliance/fisheries-compliance-enforcement), with reports for each year from 2010/11 to 2015/16 currently posted on the website.
During 2015/16, across all NSW fisheries, around 57,000 client contacts were made (not including surveillance), resulting in 4,000 warnings, 2400 penalty notices and 69 prosecutions. There were 2400 items of fishing gear confiscated, of which 55 were mesh nets. There were no haul nets confiscated.
In the EGF specifically, rates of compliance between 2012-13 and 2015-16 were (NSW DPI, 2017b):
- 2012-13 – 83.77%
- 2013-14 – 84.39%
- 2014-15 – 73.37%
- 2015-16 – 77.8%
These rates of compliance are lower than might be expected from a highly compliant fishery.
In addition, recent evidence suggests at least moderate rates of non-compliance with some species specific measures. For example, Mulloway are currently assessed as overfished (Earl et al 2016, Hughes, 2015), with the majority of commercial harvest (88% in 2014/15 and 74% in 2015/16) landed by the EGF with almost all those (>95%) being caught in mesh nets. In order to promote recovery of Mulloway, a by-catch allowance (possession limit) of 10 fish between 45 and 70 cm was established in November 2013. A review of the Mulloway recovery program in 2016 identified that “the possession limit of 10 fish between 45 and 70 cm has been breached in 25% of observed catches” (NSW DPI, 2016b). The review concluded that “The reason for this possession allowance was to encourage Estuary General mesh net fishers to change their fishing practices to avoid mulloway. It was acknowledged that even with altered fishing practices that juvenile mulloway would be captured at certain times and places and the possession allowance was designed to minimise waste of these fish. While anecdotal evidence indicates some fishers have changed fishing practices when mesh netting, it is apparent from the data that the changes in fishing practices by the Estuary General mesh net sector as a whole have not been effective at avoiding or minimising mulloway catch”.
Given the moderate compliance rate and concerns about compliance with some species specific measures, we scored this SI medium risk. Evidence of stronger compliance rate would be required for a lower risk score.
CRITERIA: (iv) There is a system for monitoring and evaluating the performance of the fishery specific management system against its objectives.
There is effective and timely review of the fishery specific management system.
| (a) Evaluation coverage |
MEDIUM RISK |
|
Performance of the management system is monitored through the FMS. The FMS sets out operational objectives and performance indicators across the main elements of the management systems: target species, byproduct species, bycatch species, ecosystems and social indicators. While the framework to assess key parts of the fishery-management system is in place, there is no independent sources of information to verify some issues (e.g. bycatch composition, ETP species interactions), and much of the information appears to be dated. Stock status of the main target species is assessed annually.
| (b) Internal and/or external review |
LOW RISK |
|
Performance of the management system is subject to regular review against the trigger points in the FMS (e.g. DPI, 2016a). The fishery is occasionally assessed externally by the Commonwealth Department of the Environment under the Environment Protection and Biodiversity Conservation Act 1999 with these assessments occurring every three years with the last being recorded in 2017.
PI SCORE – MEDIUM RISK
Acknowledgements
This seafood risk assessment procedure was originally developed for Coles Supermarkets Australia by MRAG Asia Pacific. FRDC is grateful for Coles’ permission to use its Responsibly Sourced Seafood Framework.
It uses elements from the GSSI benchmarked MSC Fishery Standard version 2.0, but is neither a duplicate of it nor a substitute for it. The methodology used to apply the framework differs substantially from an MSC Certification. Consequently, any claim about the rating of the fishery based on this assessment should not make any reference to the MSC.