
Eastern King Prawn – Queensland East Coast Otter Trawl Fishery
Assessment Summary
Fishery Overview
This summary is adapted from DEEDI (2012):
The Queensland East Coast Otter Trawl Fishery (ECOTF) targets prawns, scallops, bugs and squid. Various byproduct (permitted) species are also retained by the fleet. The ECOTF is the largest fishery in Queensland, both in terms of the volume of product caught and economic value of the product.
The ECOTF covers all tidal waters (excluding estuaries) east of longitude 142°31.89’E out to the East Coast Offshore Constitutional Settlement (OCS) Boundary between Cape York and the Queensland/New South Wales (NSW) border. The type of fishery symbol attached to a commercial fishing licence delimits the area that can be fished.
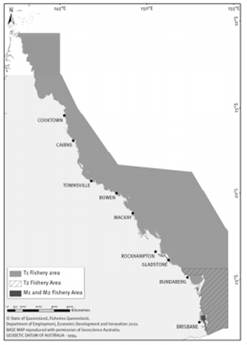
Figure 1: Area of the Queensland East Coast Trawl Fishery (DEEDI, 2012)
Demersal otter trawling is used in the fishery with variations to the standard prawn trawl gear allowed under the Trawl Plan. For example, stronger net and ground gear is permitted when targeting scallops to reduce shell cuts; and to account for the larger size of scallops compared to prawns.
Triple and quad net arrangements (three or four towed nets) are frequently used in the fishery depending on the species targeted, fishing conditions and length of the net allowed under the Trawl Plan. Queensland east coast otter trawlers have traditionally used flat, rectangular ‘otter’ boards to spread their nets, but there is an increasing tendency to use more streamlined and smaller boards.
The fishery is managed by a range of input (effort) and output (harvest) controls directed at ensuring the ecologically sustainable harvest of target and by-product species whilst minimising the impacts on bycatch and the environment.
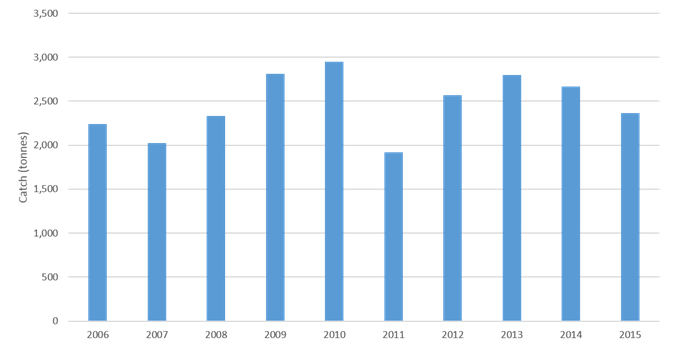
Figure 2 Trend in total catch
Risk Scores
|
Performance Indicator |
Risk Score |
|
MEDIUM RISK |
|
|
1A: Stock Status |
LOW RISK |
|
1B: Harvest Strategy |
PRECAUTIONARY HIGH RISK |
|
1C: Information and Assessment |
LOW RISK |
|
C2 ENVIRONMENTAL IMPACT OF FISHING |
MEDIUM RISK |
|
2A: Other Species |
MEDIUM RISK |
|
2B: ETP Species |
MEDIUM RISK |
|
2C: Habitats |
MEDIUM RISK |
|
2D: Ecosystems |
LOW RISK |
|
C3 MANAGEMENT |
MEDIUM RISK |
|
3A: Governance and Policy |
LOW RISK |
|
3B: Fishery-specific Management System |
MEDIUM RISK |
Summary of main issues
- A key challenge in the harvest strategy across all stocks is the existence of considerable unused harvesting capacity, with around half of the available effort units in the fishery unused in recent years. Few mechanisms currently exist to control and manage effort shifts within the fishery (either geographically or by target species). While substantial spatial closures in the GBRMP may provide sufficient protection to maintain most of the target species above PRI, this may not be the case for EKP which are largely harvested south of the GBRMP where there are fewer closures.
- No well-defined species-specific HCRs are in place.
- There are currently no mechanisms to independently validate catch and effort and Species of Conservation Interest (SOCI) logbooks
- There is no current ongoing monitoring of non-retained species composition or abundance, or interactions with ETP species.
Outlook
| Component | Outlook | Comments |
| Target species | Improving | Harvest strategies with well-defined harvest control rules will be developed by 2018 as part of the Queensland Government’s Queensland Sustainable Fisheries Strategy 2017-2027. |
| Environmental impact of fishing | Improving | The outcomes of an ecological risk assessment for the fishery south of the GBRMP, as well as other bycatch and discards research, should be available for future assessments. Additional mechanisms to validate fisher reporting will be developed as a priority under the Queensland Sustainable Fisheries Strategy 2017-2027. |
| Management system | Improving | Stakeholder engagement processes will be strengthened and fishery specific objectives will be developed as part of the Queensland Sustainable Fisheries Strategy 2017-2027. The MCS system is moving increasingly towards an intelligence and risk-drive model. |
COMPONENT 1: Target species
1A: Stock Status
CRITERIA: (i)The stock is at a level which maintains high productivity and has a low probability of recruitment overfishing.
| (a) Stock Status |
LOW RISK |
|
Eastern King Prawn (Melicertus plebejus) is endemic to Australia. Eastern King Prawn occurs on the Eastern Australian coast between Hayman Island in Queensland and north-Eastern Tasmania (20–42°S respectively). Eastern King Prawns are harvested in Queensland and New South Wales fisheries, and are considered a single multi-jurisdictional biological stock (Prosser and Taylor, 2016). This assessment examines the status of the Eastern Australian biological stock.
Prosser and Taylor (2016; and references therein) report that the most recent assessment estimates that biomass in 2010 was 60–80 per cent of the unfished 1958 levels. The assessment developed minimum monthly catch rate reference points that imply levels of biomass would be sufficient to sustain catches of MSY in each fishery region. For the Queensland component of the stock, standardised monthly regional catch rates were mostly above MSY catch rate reference points between 2009 and 2015, indicating the level of biomass was sufficient to sustain catches at MSY. For the New South Wales component of the stock, the median nominal commercial catch rates were relatively stable between 2012 and 2015, and slightly greater than catch rates prior to 2012. Fishery-independent surveys of recruit abundance show variable recruitment to the fishery with no discernible trend over 10 years. Indices of recruit abundance display peaks in 2008 and 2012. Based on the above, Prosser and Taylor (2016) conclude that the stock is unlikely to be recruitment overfished.
Given the very high estimated ratio of current to unfished biomass, there is evidence the stock is highly likely to be above the point of recruitment impairment (PRI) and probably fluctuating at or around levels capable of producing MSY.
PI SCORE – LOW RISK
1B: Harvest Strategy
CRITERIA: (i)There is a robust and precautionary harvest strategy in place
| (a) Harvest Strategy |
PRECAUTIONARY HIGH RISK |
|
The main elements of the harvest strategy for the QECOTF include:
- Limited entry through a requirement to hold a Commercial Fishing Boat License (FBL), as well as limited entry into the various sub-components of the fishery through the allocation of fishery symbols (T1, T2, M1 and M2);
- Limits on the Total Allowable Effort (TAE) in the ECOTF, allocated to each license holder as tradable ‘effort units’. The combination of effort units held and the size of the vessel determine the number of fishing days each operator can work (larger vessels require more effort units to fish one day than small vessels). M2 vessels are restricted to Moreton Bay only and are not subject to effort units;
- Gear and mesh restrictions;
- Vessel hull size restrictions;
- Spatial and temporal closures, including the closures associated with the Great Barrier Reef Marine Park Zoning Plan;
- Vessel horse power restrictions;
- Daily catch and effort reporting;
- Monitoring effort usage through VMS;
- Periodic assessment of stock status for key species.
Although the ECOTF is currently effort limited with a cap on effort of 5% less than 1996 levels, the main weakness in the harvest strategy is the existence of substantial latent effort, despite licence buybacks in 2001 and 2005. In 2016, there were a total of 2.75 million effort units for the East Coast and 73,387 effort units for T2 (Concessional) licenses of which 64% EU and 27% respectively, were utilised (DAF, 2017a). At present, there are few mechanisms to prevent or manage effort shifts within the fishery (either geographically or across different target species) and overall effort in each sector is influenced more by economics that any effective catch constraint. There are no well-defined harvest control rules for any of the main target species.
The Queensland Government has recently announced the Queensland Sustainable Fisheries Strategy 2017-2027 which commits amongst other things to improved monitoring and research and the adoption of harvest strategies for all major fisheries by the end of 2020, with a priority to develop trawl, crab and inshore fisheries strategies by the end of 2018 (DAF, 2017b). Harvest strategies will include well-defined harvest control rules and aim to maintain stocks at levels above MSY.
Despite the broad distribution of EKP, all sources of mortality are well understood and relevant estimates of catch are available for all sectors. Catch is split approximately 80:20 between Queensland (where the main adult habitats are) and NSW (where the major recruitment grounds are) (O’Neill et al., 2014).
In NSW, catches are primarily taken in the Offshore Trawl Fishery (OTF). The main measures in the harvest strategy include:
- Limited licences (and effort quota coming in 2018);
- Gear and mesh restrictions;
- Spatial zoning;
- Spatial and temporal closures;
- Daily catch and effort reporting;
- A Fishery Management System (FMS) that requires a recovery strategy to be implemented if the fishery status is assessed as ‘overfished’ or ‘recruitment overfished’;
- Periodic assessments of stock status.
O’Neill et al. (2014) developed a spatially structured model covering six separate regions of the fishery across Queensland and NSW, and estimated MSY at 3100t (95% c.i. 2454–3612 t). The 2015 catch was 2892 t (2363 t in Queensland; 529 t in New South Wales), which is below the estimate of MSY. The average catch in 2013–15 was 3135 t, which is slightly above the estimate of MSY.
Prosser and Taylor (2016) report that the most recent assessment estimates future effort (E) at MSY (EMSY), standardised to the number of boat-days in 2010, as 38,002 boat-days (95% c.i. 27,035–50,754 boat-days) assuming no further increase in fishing power or costs. An alternative estimate of 28,300 boat-days (95% c.i. 20,110–37,663 boat-days) accounts for a three per cent per year increase in fishing power over the next decade and costs from 2010 levels. Effort in 2015 was 20,076 boat-days (14,688 boat-days in Queensland; 5388 boat-days in New South Wales), which was well below both estimates of EMSY and the peak effort of around 30,000 boat-days in 2000, but similar to levels in 2013. The decline in effort since 2000 has been offset by increases in fishing power. The number of boats accessing the Eastern King Prawn sector of the QECOTF has remained stable since 2013, but has continued to decline in New South Wales.
Unlike many other species targeted in the ECOTF, the proportion of the stock protected by closures in the GBRMP is very low and the level of protection afforded by other closures (e.g. State marine parks, closures under the Fisheries Act) is unknown. An effort cap for the Southern Trawl Fishery area is in place which, if exceeded, limits each license to no more than 24 trawl fishing days per month for the months May, June and July. The intent of the closure is to maintain effort at levels consistent with EMSY estimated by Courtney et al (2014a). Nevertheless, the extent to which this measure can effectively limit overall effort is unclear because (a) days are likely to be lost each month through bad weather anyway and (b) there is nothing to prevent latent or active licences entering the fishery in years when the rule is triggered.
Accordingly, while the Eastern King Prawn stock is currently being fished at levels consistent with maintaining the stock at or above BMSY, this appears to be largely due to economic constraints rather than harvest controls which actively limit exploitation to sustainable levels. Considerable capacity for additional fishing mortality exists within the fishery and it is not clear that existing harvest strategy arrangements are sufficient to achieve the stock management objectives in criterion 1A(i) if economic circumstances change. The Eastern King Prawn stock does not appear to have the same ‘safety nets’ afforded by spatial closures as some other stocks. Accordingly, this SI has been scored precautionary high risk.
| (b) Shark-finning |
|
|
NA
CRITERIA: (ii) There are well defined and effective harvest control rules (HCRs) and tools in place.
| (a) HCR Design and application |
PRECAUTIONARY HIGH RISK |
|
There are currently no well-defined harvest control rules for any of the ECOTF stocks which set out pre-agreed measures to limit exploitation as PRI is approached. Accordingly, none of the stocks can score low risk.
The best approximation of a HCR in the fishery was the Performance Measurement System (PMS) which established trigger points, which if breached, triggered a review of available data and management arrangements if required (QG, 2009). Nevertheless, use of the PMS has been largely discontinued, with the most recent report available from 2012 (DEEDI, 2012). There is also evidence from other key target stocks within the ECOTF that existing arrangements have not served to reduce exploitation as PRI is approached (e.g. saucer scallops; Kangas and Zeller, 2016). Accordingly, it not clear that generally understood HCRs are in place that are expected to reduce exploitation as PRI is approached.
Notwithstanding that, stock monitoring in recent years has detected no evidence of recruitment overfishing for any stock assessed here and effort levels across virtually all sectors are at very low levels historically. Accordingly, we have scored this SI precautionary high risk. The Queensland Government has recently committed to the development of a harvest strategy with well-defined HCRs for the ECOTF by the end of 2018 (DAF, 2017b).
PI SCORE – PRECAUTIONARY HIGH RISK
1C: Information and Assessment
CRITERIA: (i) Relevant information is collected to support the harvest strategy.
| (a) Range of information |
LOW RISK |
|
Stock structure for Eastern King Prawn is well understood including areas of recruitment, distribution and movement in both New South Wales and Queensland. The biology of this species is also well understood (e.g. Courtney et al. 1995; Courtney et al. 1996; Lloyd-Jones et al. 2012). There are extensive catch and effort records from various fisheries in both states, and these have been used to develop a bio-economic model that provides appropriate measures such as effort at MSY and effort at MEY, to support the harvest strategy and potential harvest control rules (Courtney et al, 2014a; O’Neill et al, 2014). Also, fleet dynamics for the fishery are understood (including VMS data), with estimates of vessel power previously published (O’Neill and Leigh 2007).
| (b) Monitoring and comprehensiveness |
LOW RISK |
|
In the Eastern King Prawn sector, removals from the stock by commercial fisheries are monitored through compulsory catch and effort logbooks, while recreational catches are periodically estimated (e.g. West et al, 2015). Fisheries Queensland has routinely monitored stocks using an annual Fishery Independent Trawl (FIT) survey since 2006[1]. The FIT survey is conducted in key juvenile Eastern King Prawn habitats in southern Queensland waters during the peak recruitment period for the species (November and December). The index of abundance of recruit Eastern King Prawn produced by the survey is combined with other available fishery data to assess the status of the stock annually. These survey results, combined with standardised commercial catch rates and periodic stock assessments (e.g. O’Neill et al, 2014), are sufficient to support an effective HCR.
[1] https://www.daf.qld.gov.au/fisheries/monitoring-our-fisheries/commercial-fisheries/species-specific-programs/monitoring-reporting/Eastern-king-prawn-update
CRITERIA: (ii)There is an adequate assessment of the stock status.
| (a) Stock assessment |
LOW RISK |
|
O’Neill et al. (2014) provide a comprehensive bioeconomic model for Eastern King Prawn that simultaneously assesses six different regions across Queensland and NSW and provided several different management strategy evaluations. The model estimates biomass relative to the reference year 1958 when data and catch history were first available, and produced estimates of MSY and effort at both MSY and Maximum Economic Yield (MEY). The model is appropriate for the stock and estimates status relative to reference points which are appropriate and can be estimated.
| (b) Uncertainty and Peer review |
LOW RISK |
|
O’Neill et al (2014) accounted for uncertainty in parameters such as stock-recruitment steepness, natural mortality and annual recruitment variation through Markov Chain Monte Carlo sampling, as well as running alternative model runs accounting for different estimates of fishing power. The methodology used and outcomes were published in a peer-reviewed journal.
PI SCORE – LOW RISK – Eastern King Prawn
COMPONENT 2: Environmental impact of fishing
2A: Other Species
CRITERIA: (i) The UoA aims to maintain other species above the point where recruitment would be impaired (PRI) and does not hinder recovery of other species if they are below the PRI.
| (a) Main other species stock status |
MEDIUM RISK |
|
The intent of this scoring issue is to examine the impact of the UoA on ‘main’ other species taken while harvesting the target species. ‘Main’ is defined as any species which comprises >5% of the total catch (retained species + discards) by weight in the UoA, or >2% if it is a ‘less resilient’ species. The aim is to maintain other species above the point where recruitment would be impaired and ensure that, for species below PRI, there are effective measures in place to ensure the UoA does not hinder recovery and rebuilding.
The ECOTF is a large and complex fishery, encompassing multiple sub-sectors, across multiple bioregions and using slightly different gears and configurations of TEDs and BRDs in each sub-sector. As a result, the composition of other species taken in the fishery varies both spatially and temporally (e.g. Courtney et al., 2007). Two other species which account for > 5% of the catch (Balmain Bugs and Moreton Bay Bugs) are assessed under Component 1 in the full assessment report. Previous studies have shown that the fishery interacts with a very large number of species, most of which occur only very infrequently in trawls (e.g. Poiner et al., 1999; Courtney et al., 2007). We are aware of no recent comprehensive assessments estimating catch composition by weight for each of the sub-sectors encompassing the target species assessed here. Accordingly, it is difficult to determine which species may qualify as ‘main’ other species (>5% of the catch by weight; >2% of the catch for ‘less resilient’ species). For the Eastern King Prawn fishery there are some data available from fishery-independent research trawls (Courtney et al. 2007). For all other fisheries, a comprehensive study of the effects of fishing in the Great Barrier Reef Marine Park provides some information to assess the likely status of other species in that region (Pitcher et al. 2007).
The Eastern King Prawn fishery can be separated into two regions by depth; the shallow water and deep-water fisheries. The assemblage of other species differs substantially between these regions (Courtney et al. 2007).
There are no published data on the composition of the commercial catch (to a species level) from either the inshore or the offshore fishery. However, data are available from two fishery-independent trawl studies (Courtney et al. 2007) where mean catch rate per area trawled was determined for all living organisms in the catch (i.e. including corals and sponges) for each fishery. In the shallow water fishery, a total of 250 taxa were recorded in the 120 bycatch sub-samples, with most species being relatively uncommon. For example, 178 taxa (71% of species) occurred in fewer than 10% of sub-samples and 68 taxa (27% of species) were found in only one sub-sample. Four species comprised >5% of the catch by weight: the gurnard Lepidotrigla argus, the lizardfish Saurida grandisquamis, the flathead Platycephalus longispinis and Stout Whiting (Sillago robusta) (albeit bycatch of this species was reduced by more than 50% when nets were fitted with a radial escape section BRD and TED together).
In the deepwater fishery, overall volumes of bycatch were substantially lower than the shallow water fishery using a standard net (1.19kg/ha compared to 11.06kg/ha). When the square mesh codend BRD and TED were used together the bycatch catch rate fell significantly by 29%. A total of 227 taxa were recorded; seven taxa made up 50% of the bycatch weight and 40 taxa made up 90%. Four species comprised >5% of the total catch by weight: three-spined cardinal fish (Apogonops anomalus; 13.5%), orange-freckled flathead (Ratabulus diversidens; 10.4%), the gurnard (Lepidotrigla argus; 8.5%) and the orangemouth lizardfish (Saurida filamentosa, 5.7%).
It was noted by the authors that the locations of the study were determined from effort data of the fishery, however the catch rates of the target species (Eastern King Prawn), were likely to be lower than normal commercial fishing operations because when fishers found higher densities of prawns they would tend to trawl over these same grounds. This means that any measures of % catch for other species examined here are likely to be conservative (i.e. % of other species are likely to be higher here than during commercial trawling).
Of the species in each sector comprising >5% of the catch, only Stout Whiting has had a quantitative assessment undertaken. Roy and Hall (2016) report that population modelling conducted in 2014 indicated that biomass was marginally above the biomass that would produce MSY. Accordingly, the species is highly likely to be above PRI.
The remaining species were assessed using Productivity-Susceptibility Analysis (PSA) consistent with the MSC’s Risk Based Framework (Annex 1). Each species was scored low or medium risk. Accordingly, we have scored this SI medium risk overall. Nevertheless, we note that an ecological risk assessment (ERA) of trawling in the ECOTF south of the GBRMP has recently been completed and is currently in review. The outcomes of this assessment may be able to better inform scoring against this indicator when released.
It was noted by the authors that the locations of the study were determined from effort data of the fishery, however the catch rates of the target species (Eastern King Prawn), were likely to be lower than normal commercial fishing operations because when fishers found higher densities of prawns they would tend to trawl over these same grounds. This means that any measures of % catch for other species examined here are likely to be conservative (i.e. % of other species are likely to be higher here than during commercial trawling).
Of the species in each sector comprising >5% of the catch, only stout whiting has had a quantitative assessment undertaken. Roy and Hall (2016) report that population modelling conducted in 2014 indicated that biomass was marginally above the biomass that would produce MSY. Accordingly, the species is highly likely to be above PRI.
The remaining species were assessed using Productivity-Susceptibility Analysis (PSA) consistent with the MSC’s Risk Based Framework (Annex 1). Each species was scored low or medium risk. Accordingly, we have scored this SI medium risk overall. Nevertheless, we note that an ecological risk assessment (ERA) of trawling in the ECOTF south of the GBRMP has recently been completed and is currently in review. The outcomes of this assessment may be able to better inform scoring against this indicator when released.
CRITERIA: (ii) There is a strategy in place that is designed to maintain or to not hinder rebuilding of other species; and the UoA regularly reviews and implements
| (a) Management strategy in place |
MEDIUM RISK |
|
There are a number of management measures that are largely common across each of the units of assessment which are designed to limit the impact of the ECOTF on non-target species. These include:
- Spatial and temporal closures: Considerable spatial and temporal closures exist within the area of the ECOTF, and in particular in the area of the GBRMP. Closures are enacted under Queensland fisheries legislation (for example, all areas in the GBRMP either untrawled or lightly trawled were closed to trawling in 1999 under the East Coast Trawl Plan, in addition to a large number of pre-existing closures for resource allocation of resource protection purposes), State marine parks legislation (e.g. Moreton Bay Marine Park and Great Sandy Strait Marine Park) and the GBRMP Zoning Plan. Pears et al. (2012) estimated that trawling is permanently excluded from 66.2% of the GBRMP and approximately 42% of the total fishery area;
- Effort reduction and cap: In the last two decades significant reductions in nominal effort have occurred for the fishery. Also an effort cap has been established to maintain the fishery at 5% less effort than 1996 levels;
- Bycatch reduction devices: The Trawl Plan requires the mandatory use of BRDs and TEDs of particular specifications. A rebate scheme has been offered by the Queensland Government to assist operators install square mesh cod ends and half round square mesh cod ends in their nets. These devices are particularly important to reduce the risk to sharks and rays that were identified as the highest risk category by Pears et al. (2012);
- Size and trip limits apply for several species; and
- Substantial research effort and risk assessments to understand and minimise the impacts of the fishery on non-target species (e.g. Poiner et al, 1999; Pitcher et al, 2007; Courtney et al, 2007; Pears et al, 2012).
Although many of the spatial closures within the fishery area were not established specifically for fisheries management, clearly they play an important role in reducing the impact of the fishery on populations of other species in the region. Considerable research effort has been undertaken to develop bycatch reduction technologies that have proven to substantially reduce the risks to other species as well (e.g. Courtney et al. 2007; Courtney et al. 2010). Importantly, the agency has acted to ensure implementation through legislation. Collectively these measures could be expected to maintain other species at levels which are likely to be above the PRI. Nevertheless, there are ongoing weaknesses in the collection of information (e.g. there is no ongoing independent verification of bycatch species composition and volume) which limit the capacity of the management agency to formulate and monitor the effectiveness of a strategy to limit the impacts of the UoAs on other species which mean the fisheries cannot score low risk. Accordingly, we have scored this SI medium risk.
| (b) Management strategy evaluation |
MEDIUM RISK |
Research into the effectiveness of bycatch reduction devices (e.g. Courtney et al, 2007; 2008; 2014b) provides some objective basis for confidence that these measures will work while the Fisheries Queensland compliance program provides some basis for confidence that the measures are being implemented successfully. BRD related compliance from 2014-16 was generally high (DAF, 2017c).
In addition, substantial reductions in fishing effort over the past 10-15 years provide a plausible argument that overall impacts on bycatch are likely to be reducing. Nevertheless, there are fewer spatial closures in the area of the Eastern King Prawn fishery than many other sectors and only limited data on commercial catch composition by weight with no ongoing monitoring. To that end, there is no overall objective basis for confidence that the measures will work and are being implemented effectively.
| (c) Shark-finning |
NA
CRITERIA: (iii) Information on the nature and amount of other species taken is adequate to determine the risk posed by the UoA and the effectiveness of the strategy to manage other species.
| (a) Information |
MEDIUM RISK |
A substantial body of research work is available to assess the impacts of the ECOTF on non-target species including fishery-independent studies on shallow and deepwater Eastern King Prawn stocks (Courtney et al. 2007), quantitative studies on trawling in the GBRMP (Poiner et al, 1999; Pitcher et al. 2007) and a more recent qualitative risk assessment (Pears et al. 2012). Accordingly, while some quantitative data exist to assess the impact of the UoAs on other species, the main weakness is the absence of ongoing monitoring of non-target species composition and volume which limits the ability of the management agency to monitor the effectiveness of any strategy and to detect increased risk. Notwithstanding that, we note that a project is currently underway to estimate the composition and quantity of discards from the ECOTF during the period 1988 – 2014. This project should provide an empirical basis to examine the impact of effort reductions and management measures such as the introduction of TEDs and BRDs, reductions in fishing effort on other species[1].
[1] https://www.daf.qld.gov.au/services/news-and-updates/fisheries/news/research-underway-on-queenslands-east-coast-trawl-fishery
PI SCORE – MEDIUM RISK
2B: Endangered Threatened and/or Protected (ETP) Species
CRITERIA: (i) The UoA meets national and international requirements for protection of ETP species.
The UoA does not hinder recovery of ETP species.
| (a) Effects of the UoA on populations/stocks |
MEDIUM RISK |
|
The ECOTF interacts with a number of protected species including turtles, sea snakes, sawfish and sygnathids (e.g. Pears et al, 2012; DOE, 2013). The introduction of mandatory measures such as the use of turtle excluder devices and bycatch reduction devices in all trawl nets has significantly reduced the capture rate of most of these groups and the majority are released alive (DOE, 2013). Since the introduction of mandatory turtle excluder devices in the fishery, turtle and sawfish captures have been low with four turtles and one sawfish captured in 2012, all released alive (DOE, 2013).
In recent years, particular attention has been paid to the bycatch of sea snakes in the ECOTF. All species of sea snake are ‘listed marine species’ under the Commonwealth Environment Protection and Biodiversity Conservation Act 1999 (EPBC Act) and protected under the Great Barrier Reef Marine Park Act 1975 and the Queensland Nature Conservation Act 1992. Based on sampling between 2005 and 2007, Courtney et al (2010) estimated 105,210 (s.e. 18,288) sea snakes, composed of 12 species, were caught in the fishery annually. Of these, around 26% were estimated to die as a result of capture. Mortalities were highest in the Redspot King Prawn fishery which accounted for 58.9% of all sea snake catches and 84.5% of all mortalities. In general, trawl fishing sectors south of about 20oS (i.e. the Eastern King Prawn, Stout Whiting, beam trawl, Moreton Bay, Banana Prawn and Saucer Scallop fisheries) imposed relatively little incidental mortality on sea snake populations, mainly because catch rates were low or survival rates were high. Based on the risk modelling approach of Pitcher et al (2007), Courtney et al (2010) estimated that the level of incidental fishing mortality for one species of sea snake, Hydrophis elegans, was marginally above that associated with maximum sustainable yield and therefore, that recruitment for H. elegans is being reduced by trawling. However, they also noted that this “should not be interpreted as a high risk of extinction from the Queensland east coast” and also that “in general, the risk of incidental mortality approaching levels that are associated with recruitment failure appears low for all species, while the risk of localised (i.e. with the GBRMP) extinction due to trawling is highly unlikely”.
On 1 March 2015, fisheye and square mesh cod end (SMCE) BRDs were made mandatory for trawl nets fishing all ECOTF sectors except the saucer scallop sector “where SMCEs offer an optimum in terms of low sea snake bycatch and low catch of undersized Moreton Bay Bugs‑the main scallop fishing byproduct species” (DAF, 2017c). Courtney et al (2010) estimated that the fisheye and SMCE BRDs reduced the catch rate of sea snakes by 63% and 60%, respectively.
DAF (2017c) report that “subsequent analysis of sea snake interactions based on the effort-weighted method of Courtney et al., (2010) indicate that management changes and reduction in effort in the ECOTF are likely to have progressively reduced sea snake interactions and related mortality since these were first quantified. Estimates indicate that the mean annual number of sea snakes captured in 2008-13 was 40% less than in 2003-07. At 47 118 sea snakes in 2014-15, it is estimated that 50% fewer sea snakes were captured than in 2003-07 (Figure 3). Importantly, the percentage decline in mean annual sea snake mortality has been even greater; the 2008-13 estimate is 50% less than in 2003-07, and at 5 330 sea snakes, mortality in 2014-15 was only 31% of the 2003-07 estimate (Figure 3).
Based on these estimates and the previous risks assessed by Courtney et al (2010), it appears the measures in place could be expected to ensure the ECOTF does not hinder recovery of sea snake species.
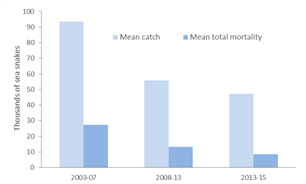
Figure 3: Trends in mean sea snake catch and mortality in the ECOTF from 2003-15. (Source: DAF, 2017c)
DOE (2013) also note that the fishery interacts with two species of seahorse, three species of pipefish and one species of pipehorse. Pears et al (2012) assessed each of these species to be at intermediate risk from trawling operations as bycatch reduction devices are ineffective at excluding these species and they have low post capture survival. However, large areas of the Great Barrier Reef Marine Park are closed to trawling (66% of the marine park) and there are trip limits placed on the harvest of these species.
Overall DOE (2013) concluded that “given the management measures in place in the fishery, including:
- limited entry
- tradable effort units
- gear restrictions (net and boat)
- mandatory bycatch reduction devices and turtle excluder devices
- spatial and temporal closures,
the Department considers that the current operation of the fishery is not likely to adversely affect the survival or recovery in nature of any listed threatened species.”
While the available evidence indicates it is likely the current operation of the fishery is not hindering recovery of ETP species, the absence of ongoing independent data collection on interactions means this cannot be concluded with high certainty. Accordingly, we have scored this SI medium risk.
| (a) Management strategy in place |
MEDIUM RISK |
|
The measures in place to minimise the impact of the ECOTF on ETP species include:
- Spatial closures – trawling is permanently excluded from 66.2% of the GBRMP and approximately 42% of the total fishery area (Pears et al. 2012);
- Bycatch reduction devices – the Trawl Plan and subsequent amendments requires the mandatory use of BRDs and TEDs of particular specifications. TEDs are particularly important for turtle and sawshark exclusion (e.g. Courtney et al, 2007; Pears et al, 2012). From 1 March 2015, fisheye and SMCE BRDs were made mandatory for trawl nets fishing all ECOTF sectors for the purpose of sea snake bycatch reduction, except the saucer scallop sector. In the scallop sector, SMCEs offer an optimum in terms of low sea snake bycatch and low catch of undersized Moreton Bay Bugs‑the main scallop fishing byproduct species (DAF, 2017c). Courtney et al (2010) estimated that the fisheye and SMCE BRDs reduced the catch rate of sea snakes by 63% and 60%, respectively.
- Effort reduction and cap – In the last two decades, significant reductions in nominal effort have occurred for the fishery, within an overall effort cap of 5% less effort than 1996 levels;
- A requirement for live release of ETP species;
- Monitoring of interactions through a mandatory, separate SOCI logbook which has been in place since 2002;
- Targeted research to quantify levels of interactions and the effectiveness of mitigations measures (e.g. Courtney et al, 2007, Courtney et al, 2010).
Accordingly, the ECOTF currently has a range of measures in place that are expected to ensure the fishery does not hinder recovery of ETP species. The main weakness at the moment is the absence of a mechanism to validate reporting in SOCI logbooks, which has been under-reported for some species historically (e.g. Courtney et al, 2010). DAF (2017c) report that a means of validating SOCI logbooks will be established as a priority as part of the recently announced Queensland Sustainable Fisheries Strategy.
| (b) Management strategy implementation |
LOW RISK |
|
Independent research on the effectiveness of mitigation measures (e.g. Courtney et al, 2007; 2010; Pitcher et al, 2007) provides some objective basis for confidence that the measures will work. In the case of sea turtles for example, Pears et al (2012) report that trawl catch rates (number of animals landed on deck) have declined over 100-fold from more than 5000 to two to three reported marine turtle landings annually. With appropriate handling and resuscitation methods, survival has also improved substantially, with no recorded mortality from trawling in the Great Barrier Reef Region in 2008 and 2009. Compliance information provides evidence that the measures are being implemented successfully. For example, DAF (2017c) reports that BRD related compliance from 2014-16 was generally high (~95%).
CRITERIA: (iii) Relevant information is collected to support the management of UoA impacts on ETP species, including:
- information for the development of the management strategy;
- information to assess the effectiveness of the management strategy; and
- information to determine the outcome status of ETP species.
| (a) Information |
MEDIUM RISK |
|
Interactions with ETP species is primarily monitored through a mandatory SOCI logbook which has been in place since 2002, as well as through targeted research studies (e.g. Courtney et al, 2007; 2010; Pitcher et al, 2007). The effectiveness of TEDs for turtles, sharks and rays is well understood (e.g. Courtney et al. 2007), as is the population status of Australia’s marine turtles (e.g. Limpus et al., 2013). Moreover, research on sea snake interactions has been sufficient to assess risk from each sector, as well as support new regulations on the mandatory use of best practice BRDs through the ECOTF (Courtney et al, 2010). A comprehensive qualitative ERA has been undertaken on the impacts of the fishery, including on ETP species, in the GBRMP area (Pears et al, 2012), and a complementary ERA has recently been completed (albeit is not yet publicly available) for the area south of the GBRMP area (DAF, 2017c).
As discussed above, given the fishery has the capacity to interact with a number of ETP species the main weakness at present is the absence of measures to independently validate SOCI logbook reporting in order to monitor the effectiveness of mitigation measures. DAF (2017c) report that this will be addressed as a priority as part of the recently announced Queensland Sustainable Fisheries Strategy.
PI SCORE – MEDIUM RISK
2C: Habitats
CRITERIA: (i) The UoA does not cause serious or irreversible harm to habitat structure and function, considered on the basis of the area(s) covered by the governance body(s) responsible for fisheries management
| (a) Habitat status |
MEDIUM RISK |
|
Examples of “serious or irreversible harm” to habitats include the loss (extinction) of habitat types, depletion of key habitat forming species or associated species to the extent that they meet criteria for high risk of extinction, and significant alteration of habitat cover/mosaic that causes major change in the structure or diversity of the associated species assemblages (MSC, 2014). Further, MSC specifies that if a habitat extends beyond the area fished then the full range of the habitat should be considered when evaluating the effects of the fishery. The ‘full range’ of a habitat shall include areas that may be spatially disconnected from the area affected by the fishery and may include both pristine areas and areas affected by other fisheries.
It is recognized that when demersal trawl gear touches the bottom, damage may be done to the benthic environment and the communities that dwell there. Depending on the type of habitat, type of interaction, its duration and frequency; some areas may receive longer lasting damage while other areas will be able to recover in relatively short time periods. Damage to some habitats may occur with minimal trawling due to the nature of the benthic organisms and the depth (e.g. biogenic habitat with vertical relief). Damage will, however, be restricted to areas trawled so that, the extent of any damage will be in proportion to the trawl footprint of the fishery.
There is little direct information on habitat status and interactions south of the GBRMP where Eastern King Prawn are targeted. However, there are substantial spatial closures associated with the Moreton Bay Marine Park (MBMP) and Great Sandy Strait Marine Park (GSSMP), as well as many inshore closures under the Trawl Plan. In the case of the MBMP, closures were designed to protect a representative sample of habitats within the park. In the northern extent of the UoA, closures within the GBRMP under the GBRMP Zoning Plan are designed to protect at least 20% of each bioregion in the marine park in no-take areas. While these measures in combination with more generic measures such as effort and gear limitations are probably sufficient to ensure that the UoA is unlikely to reduce structure and functions of habitats to the point where there would be serious or irreversible harm, there is insufficient information on the overlap of the fishery with habitats south of the GBRMP at this stage to justify a score of ‘highly likely’ (i.e. low risk). We note that a risk assessment of the ECOTF south of the GBRMP has recently been completed, albeit is not yet publicly available. Relevant outcomes of this assessment should be taken into account in future assessments when it becomes publicly available.
CRITERIA: (ii) There is a strategy in place that is designed to ensure the UoA does not pose a risk of serious or irreversible harm to the habitats.
| (a) Management strategy in place |
MEDIUM RISK |
|
There are a number of management measures to limit habitat impacts in the ECOTF. These include:
- Spatial closures – trawling is permanently excluded from 66.2% of the GBRMP and approximately 42% of the total fishery area (Pears et al. 2012). Closures protect sensitive, representative habitats within the GBRMP, MBMP and GSS MP.
- Effort reduction and cap – In the last two decades, significant reductions in nominal effort have occurred for the fishery, within an overall effort cap of 5% less effort than 1996 levels;
- Gear restrictions: The size and power of vessels and the gear that they trawl with are restricted through legislation. Of particular importance for habitats is the restriction on the weight of chains.
- VMS: all vessels are required to use VMS to monitor compliance with spatial and temporal closures, and to efficiently target compliance activity.
In addition, considerable research activity has been undertaken to evaluate and manage the impacts of the fishery on habitats and to inform management strategies, particularly within the GBRMP (e.g. Poiner et al, 1999; Pitcher et al, 2007).
Notwithstanding that, we note that significant latent capacity exists within the management system which, if activated, may influence the overall habitat impacts of the fishery. Any new information on trends in the overall level and spatial distribution of trawl effort in the context of habitats within the ECOTF should continue to be evaluated in future assessments.
While the northern part of the Eastern King Prawn fishery occurs in the GBRMP, much of the stock exists to the south of the GBRMP boundary where there are fewer spatial closures. While measures are in place which could be expected to ensure habitat structure and function is not reduced to the point of serious or irreversible harm (e.g. closures in the GBRMP, inshore spatial closures under the MBMP, GSSMP, Fisheries Act) there is insufficient evidence at this stage to conclude this was ‘highly likely’ (i.e. low risk). As above, we note that a risk assessment of the ECOTF south of the GBRMP has recently been completed, and relevant outcomes of this assessment should be factored into future assessments when available.
| (b) Management strategy implementation |
MEDIUM RISK |
|
Closed areas, effort caps and gear restrictions are all effective management tools that are proven effective in management of habitat impacts, when coupled with an appropriate compliance program. Representative closures under the MBMP and GSMP, closures to some bioregions in the northern part of the fishery in the GBRMP, together with effort reductions and the relatively concentrated spatial footprint of the fishery provide a plausible argument that the existing measures will work. However, the area south of the GBRMP has not yet been subject to the same degree of analysis as the part within the GBRMP and is subject to fewer spatial closures protecting representative habitats. Accordingly, there is less information to support an objective basis for confidence that the measures will work and we have scored this SI medium risk. We note that an ecological risk assessment for the QECOTF south of the GBRMP is currently in review and will likely provide additional information to support scoring against this SI.
CRITERIA: (iii) Information is adequate to determine the risk posed to the habitat by the UoA and the effectiveness of the strategy to manage impacts on the habitat.
| (a) Information quality |
LOW RISK |
|
The majority of the spatial area of the QECOTF occurs within the GBRMP. Despite ongoing information gaps, the GBRMP area is one of the most well-studied marine environments in the world. Pitcher et al (2007) comprehensively assessed the seabed biodiversity within the GBRMP, while habitat types were mapped in considerable detail to support the rezoning of the GBRMP in 2004 (e.g. Kerrigan et al, 2010). This mapping exercise was informed by decades of independent scientific research. The nature, distribution and vulnerability of the main habitat types south of the GBRMP are less studied, but are probably sufficiently well-known (e.g. DEWHA, 2007; Brewer et al, 2007; Keene et al, 2008) to formulate an effective strategy to ensure the ECOTF does not reduce habitat structure and function to the point of serious or irreversible harm.
| (a) Information and monitoring adequacy |
LOW RISK |
|
Detailed information is available on the main impacts of the UoAs on the main habitat types of the GBR (e.g. Poiner et al, 1999; Pitcher et al, 2007), and VMS information provides fine scale information on fishing effort sufficient to detect any increase in risk. For the Eastern King Prawn fishery, information from the GBRMP is adequate to allow for the identification of the main impacts of the UoA, as well monitor the spatial extent of interaction.
PI SCORE – MEDIUM RISK – Eastern King Prawn
2D: Ecosystems
CRITERIA: (i) The UoA does not cause serious or irreversible harm to the key elements of ecosystem structure and function.
| (a) Ecosystem Status |
LOW RISK |
|
Serious or irreversible harm in the ecosystem context should be interpreted in relation to the capacity of the ecosystem to deliver ecosystem services (MSC, 2014). Examples include trophic cascades, severely truncated size composition of the ecological community, gross changes in species diversity of the ecological community, or changes in genetic diversity of species caused by selective fishing.
Pitcher et al. (2007) demonstrated that trawling impacts on habitats and their associated species assemblages were at sustainable levels, and were highly unlikely to be causing serious or irreversible effects to the ecosystem of the GBR. In addition, Pears et al (2012) assessed 14 ecosystem processes, all of which were considered to be at low risk from trawling.
While similar studies have not been conducted in the region south of the GBR where Eastern King Prawn are targeted, similar reductions in effort have been observed in this region since the late 1990s and therefore it is considered highly unlikely that the fishery is causing serious or irreversible harm to the ecosystem. Notably, there have been several quantitative studies on the impacts of trawl bycatch reduction devices in this region (Courtney et al. 2007) that provide additional confidence that these gear modifications further reduce the impact of trawling on individual species, species assemblages and ETPs.
CRITERIA: (ii) There are measures in place to ensure the UoA does not pose a risk of serious or irreversible harm to ecosystem structure and function.
| (a) Management strategy in place |
LOW RISK |
|
The measures in place to manage ecosystem impacts are largely the same as those in place for target species, ETP species and habitats, namely gear and effort restrictions, large scale spatial closures, BRDs and TEDs, VMS and targeted research. Collectively these measures constitute at least a partial strategy which is expected to restrain impact of the UoA on the ecosystem so as to achieve the outcome stated in criterion 2D(i).
| (b) Management strategy implementation |
LOW RISK |
|
Pitcher et al. (2007) provides objective evidence that these measures are likely to work and indeed that they are being implemented successfully. While similar studies have not been conducted in the region south of the GBR where Eastern King Prawn are targeted, several studies on bycatch reduction devices that have since been implemented through legislation provide increased confidence that the impact of the fishery on other species and ETPs is minimised. Together these studies provide sufficient confidence and evidence that these measures are being implemented successfully.
CRITERIA: (iii) There is adequate knowledge of the impacts of the UoA on the ecosystem.
| (a) Information quality |
LOW RISK |
|
Pitcher et al. (2007) provides an excellent basis for understanding the ecosystem and determining measures to assess changes in risk. Again, while the region south of the GBR where Eastern King Prawn are targeted has not been studied in this detail, additional information on the impact of bycatch reduction devices on ETP and individual species augments the work from the Seabed Biodiversity Project. Together this information is sufficient to assess changes in risk to the ecosystem.
| (b) Investigations of UoA impacts |
LOW RISK |
|
The main impacts of the fishery on the main ecosystem elements can be inferred from existing information (e.g. Poiner et al, 1999; Pitcher et al, 2007) and some have been investigated in detail.
PI SCORE – LOW RISK
COMPONENT 3: Management system
3A: Governance and Policy
CRITERIA: (i) The management system exists within an appropriate and effective legal and/or customary framework which ensures that it:
- Is capable of delivering sustainability in the UoA(s); and
- Observes the legal rights created explicitly or established by custom of people dependent on fishing for food or livelihood.
| (a) Compatibility of laws or standards with effective management |
LOW RISK |
|
The Queensland Government management and legislative framework is consistent with local, national or international laws or standards that are aimed at achieving sustainable fisheries in accordance with Components 1 and 2.
| (b) Respect for Rights |
LOW RISK |
|
The rights of customary fishers are recognised by the s14 exemption in the Fisheries Act that allows for an “Aborigine or Torres Strait Islander” to take fish for “the purpose of satisfying a personal, domestic or non-commercial communal need”. Additional customary rights may be sought under Commonwealth Native Title legislation.
CRITERIA: (ii) The management system has effective consultation processes that are open to interested and affected parties. The roles and responsibilities of organisations and individuals who are involved in the management process are clear and understood by all relevant parties.
| (a) Roles and Responsibilities |
LOW RISK |
|
The roles and responsibilities of the main organisations and individuals involved in the management process are explicitly defined and well understood, despite the complexities associated with fisheries management in the GBRMP. FQ are responsible for day-to-day management of the QCRFF. GBRMPA are responsible for the broader management of the GBRMP, including spatial management decisions. Accountability relationships between the main agencies and their responsible Ministers are clear. Formal processes exist to coordinate activity within and adjacent to the GBRMP between Commonwealth and State governments. Compliance functions are carried out primarily by the QB&FP, although GBRMPA and DERM staff are also authorised officers under the Fisheries Act.
| (b) Consultation Process |
MEDIUM RISK |
|
Until very recently, consultation was undertaken on a targeted, ad hoc basis, primarily with key stakeholder representative organisations, with formal processes to seek information from the main affected parties on important regulatory changes (e.g. release of Regulatory Impact Statements [RISs] seeking public comment). In mid-2017, a multi-stakeholder Trawl Fishery Working Group (TFWG) was established as part of the Queensland Government’s Sustainable Fisheries Strategy 2017-2027. The objectives of the TFWG are to:
- To assist with the development of management options for the ECOT Fishery consistent with the Sustainable Fisheries Strategy.
- To assist with the development of a harvest strategy for the ECOT Fishery by the end of 2018.
- To provide advice to Fisheries Queensland on operational issues and management of ECOT Fishery.
The TFWG includes membership from Fisheries Queensland as well as representatives from the commercial and recreational fishing sectors, GBRMPA and the conservation sector.
The key considerations around whether this SI scores low risk is whether the consultation process regularly seek and accept relevant information from all interested parties, including local knowledge, and whether the management system demonstrates consideration of the information obtained. The medium risk criteria require consultation processes that obtain relevant information from the main affected parties, including local knowledge, to inform the management system. While the new consultative structure appears capable of being a mechanism to meet the low risk criteria, the evidence base is limited given the working group has only recently been established. To that end, we have scored this SI medium risk given the management system does include consultation processes which seeks to obtain relevant information from the main affected parties (e.g. through RISs). Should the new consultative structure regularly seek and accept relevant information from all interested parties, including local knowledge, and demonstrates consideration of the information obtained, this SI may score low risk in future assessments.
Additional measures to strengthen stakeholder engagement included in the Queensland Sustainable Fisheries Strategy: 2017–2027 include:
- The establishment of an expert advisory panel to provide independent advice to the responsible minister and Fisheries Queensland on best practice fisheries management and evidence-based decision-making;
- Work with Indigenous groups and communities through various forums to ensure they are engaged in fisheries management processes, such as fishery-specific harvest strategies (DAF, 2017b).
CRITERIA: (iii) The management policy has clear long-term objectives to guide decision making that are consistent with MSC fisheries standard, and incorporates the precautionary approach.
| (a) Objectives |
LOW RISK |
|
The Fisheries Act 1994 contains clear long term objectives that are consistent with Components 1 and 2 and the precautionary approach. These are explicit and required by legislation.
PI SCORE – LOW RISK
3B: Fishery Specific Management System
CRITERIA: (i) The fishery specific management system has clear, specific objectives designed to achieve the outcomes expressed by Components 1 and 2.
| (a) Objectives |
MEDIUM RISK |
|
Explicit objectives for the fishery are set out in the Fisheries (East Coast Trawl) Management Plan 2010, namely to:
provide for the use, conservation and enhancement of the community’s fisheries resources by managing the east coast trawl fishery in a way that seeks to— (a) apply and balance the principles of ecologically sustainable development; and (b) promote ecologically sustainable development.
Although the principles of ESD are consistent with Components 1 and 2, they provide only generic guidance in the management of the fishery and are more consistent with the medium risk rather than low risk SG.
More measurable ‘operational’ objectives and performance indicators were included in the Performance Management System (PMS) for the fishery, although monitoring against the PMS has been largely discontinued. The adoption of more operational level harvest strategies and ecological risk assessments under the Queensland Sustainable Fisheries Strategy: 2017–2027 may establish clearer short and long term objectives at the fishery level.
CRITERIA: (ii) The fishery specific management system includes effective decision making processes that result in measures and strategies to achieve the objectives .
| (a) Decision making |
LOW RISK |
|
The Queensland Government Minister responsible for the fisheries portfolio has ultimate responsibility for the management of the fishery, and is empowered to make changes in accordance with powers under the Fisheries Act 1994. The Minister is advised by Fisheries Queensland who, in turn, seek input from stakeholders and technical agencies. Some decisions may be made by the Chief Executive of FQ under a declaration.
A number of changes to management have been made in recent years in response to research and other information. Fisheries (East Coast Trawl) Amendment Management Plan (No. 1) 2014, Subordinate Legislation 2014 No. 267 effective from 1 March 2015, minimises capture of sea snakes, sea turtles and bycatch species in general. Fisheries (East Coast Trawl) Amendment Management Plan (No. 1) 2016 Subordinate Legislation 2016 No. 119 effective from 15 July 2016 made changes to mandate the use of best practice scallop SMCEs, best practice escape holes for TEDs and prohibit the use of trawl spikes.
Moreover, in response to a recent stock assessment estimating serious depletion of Ballot’s Saucer scallop stocks (Yang et al, 2016), the Queensland Government closed six scallop replenishment areas (SRAs) located off Yeppoon, Bustard Head and Hervey Bay and introduced a winter spawning closure between 1 May and 31 October each year[1]. Stakeholders were consulted on the changes and regulatory impact statements set out the regulatory alternatives and impacts.
Accordingly, there is evidence that the management system responds to serious issues identified by research and monitoring.
Nevertheless, there is less evidence that the management system responds to all issues identified by research, monitoring and consultation in an adaptive and timely manner. A review of the trawl plan commenced in 2009 and continued until 2013 before ultimately being placed on hold in light of the current review of fisheries management in Queensland. DAF noted that only management options necessary for retaining export approvals would be progressed in the meantime.[2]
|
(b) Use of the Precautionary Approach |
MEDIUM RISK |
Although there are clearly examples of precautionary measures in the management of the fishery (e.g. limits on permitted species; large scale spatial closures), the main weakness in the existence of considerable unused effort which, if activated, may change the status of target species and ecosystem components. Moreover, the absence of ongoing independent monitoring of bycatch and ETP species composition and volume limits the capacity of the management system to respond to potential impacts from the fishery. To that end, the fishery does not meet the low risk SG against this SI.
[1] https://www.daf.qld.gov.au/fisheries/consultations-and-legislation/reviews-surveys-and-consultations/scallop-fishing-closures
[2] https://www.daf.qld.gov.au/fisheries/consultations-and-legislation/reviews-surveys-and-consultations/east-coast-trawl-fishery-review
| (c) Accountability and Transparency |
MEDIUM RISK |
|
Some information on the performance of the fishery is available to stakeholders through the DAF website (e.g. stock assessments, ERAs, catch and effort history) and on request. The primary mechanism by which the fishery’s performance has historically been monitored is through the PMS, with results publicly reported through Annual Status Reports (ASR). In recent years, only core elements of the PMS have been monitored through the stock status assessment process and annual SOCI reporting requirements (DAF, 2015), with the most recent ASR produced for the 2011 fishing year[3]. Where significant management changes are required, a RIS is released calling for public comment. The RIS provides an explanation of the background to the proposed changes and alternative options considered. Nevertheless, in the absence of any formal consultative structure, it is not clear that explanations have been provided for any actions or lack of action associated with findings and relevant recommendations emerging from research, monitoring evaluation and review activity. Accordingly, we have scored this SI medium risk. We note that the newly established TFWG – and the public Communiques made available through the DAF website following each meeting – provides a mechanism through which explanations may be provided to stakeholders on any action or lack of action around recommendations arising from research and monitoring.
[3] https://www.daf.qld.gov.au/fisheries/monitoring-our-fisheries/data-reports/sustainability-reporting/queensland-fisheries-summary/east-coast-otter-trawl-fishery
[2] http://www.environment.gov.au/marine/fisheries/qld/east-coast-otter-trawl
CRITERIA: (iii) Monitoring, control and surveillance mechanisms ensure the management measures in the fishery are enforced and complied with.
| (a) MCS Implementation |
LOW RISK |
|
The MCS system in the fishery primarily comprises commercial logbooks, monitoring through VMS, at sea and land-based fisheries inspections of all sectors primarily by the QB&FP, occasional aerial surveillance, clear sanctions set out in legislation enforceable through the courts (or administratively depending on the severity of the offence) and promotion of voluntary compliance through education. Priorities for the MCS system are based on formal risk assessments, updated at least every 3-5 years or with major changes in the fishery. The MCS system has a demonstrated ability to enforce relevant management measures (e.g. DAF, 2017c).
| (b) Sanctions and Compliance |
LOW RISK |
|
The Fisheries Act 1994 establishes a framework of sanctions to deal with non-compliance, including both criminal and administrative penalties depending on the nature and severity of the offence. Although there is uncertainty about compliance with some regulatory measures (e.g. SOCI logbook reporting), evidence exists that fishers comply with the management system including providing information of importance to the effective management of the fishery. DAF (2017c) report that “from 2013-16 compliance with ECOTF management arrangements has been high. From 2013 to present, 927 otter trawl vessel inspections were conducted. A total of 273 offences were detected. This translates to an average management regime compliance rate of 86%. In order of decreasing prevalence, the type of offences committed requiring either an official caution or infringement notice with financial penalty ranged from contravening a condition of an authority (includes BRD and TED non-compliance), failing to keep or provide information as required (includes failure to keep logbooks and submit logbook returns), contravention of regulated waters (includes fishing within closure areas or periods), and possession of regulated species or undersized catch. More serious offences that led to prosecution made up only a small percentage of total offences. Most were for failing to keep or provide information as required, possession of regulated species or undersized catch and contravention of regulated waters”.
CRITERIA: (iv) There is a system for monitoring and evaluating the performance of the fishery specific management system against its objectives. There is effective and timely review of the fishery specific management system.
| (a) Evaluation coverage |
MEDIUM RISK |
|
Performance of the management system has until recently been monitored through the PMS, which sets out operational objectives and performance indicators across the main elements of the management systems: target species, byproduct species, bycatch species, ecosystems and social indicators. Nevertheless, while longer term options are being considered for future fisheries reform, including the development of harvest strategies, a decision has been made to not monitor against each fishery PMS in their entirety. However, the core elements of each PMS are still being monitored by the stock status assessment process and by the annual SOCI reporting. Accordingly, arrangements are in place to evaluate some parts of the management system but arguably not all key parts. Hence, the UoA achieves medium risk.
| (b) Internal and/or external review |
LOW RISK |
|
Performance of some aspects of the management system (e.g. stock status) are subject to annual internal review, while others are subject to review over longer cycles (e.g. compliance risk assessments). The fishery is also periodically assessed externally by the Commonwealth Department of Environment and Energy under the Environment Protection and Biodiversity Conservation Act 1999.
PI SCORE – MEDIUM RISK
Acknowledgements
This seafood risk assessment procedure was originally developed for Coles Supermarkets Australia by MRAG Asia Pacific. FRDC is grateful for Coles’ permission to use its Responsibly Sourced Seafood Framework.
It uses elements from the GSSI benchmarked MSC Fishery Standard version 2.0, but is neither a duplicate of it nor a substitute for it. The methodology used to apply the framework differs substantially from an MSC Certification. Consequently, any claim about the rating of the fishery based on this assessment should not make any reference to the MSC.