
Gemfish – Commonwealth Trawl Sector
Assessment Summary
Fishery Overview
This summary has been adapted from Helidoniotis et al (2017a):
The Commonwealth Trawl Sector (CTS) of the Southern and Eastern Scalefish and Shark Fishery (SESSF) stretches from Sydney southwards around Tasmania to Cape Jervis in South Australia, where it abuts the Great Australian Bight Trawl Sector (GABTS; Figure 1). The CTS and Scalefish Hook Sector (SHS) are major domestic sources of fresh scalefish for the Sydney and Melbourne markets, and there is minimal international export from these fisheries.
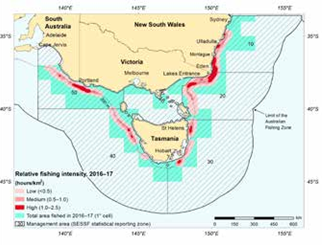
Figure 1: Relative fishing intensity in the CTS in the 2016-17 fishing season. (Source: Helidoniotis et al, 2017a).
The SESSF is a multisector, multigear and multispecies fishery, targeting a variety of fish and shark stocks using different gear types in different areas or depth ranges. Effort in the SESSF is distributed across all fishery areas, but since about 2005 has become increasingly concentrated on the shelf rather than in slope or deeper waters. The CTS predominantly uses otter trawl and Danish-seine methods. Pair trawling and midwater trawling methods are also permitted under the SESSF management plan.
In 2016–17, trawlers reported 52,215 hours of fishing effort, representing a decrease from the 54,078 hours in 2015–16 (Figure 2). The number of active trawlers decreased slightly from 37 vessels in 2015–16 to 34 vessels in 2016–17. The total landings of all species in the CTS in 2016-17 was 8,691t, down slightly from the 9,025t taken in 2015–16. Flathead, Blue Grenadier, Pink Ling, eastern school whiting and Orange Roughy (eastern zone) accounted for approximately 77 per cent of the catch.
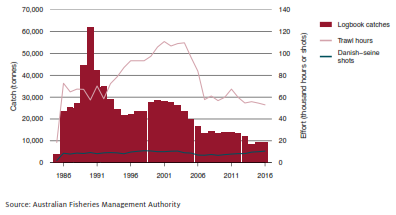
Figure 2: Total catch and fishing effort in the CTS, 1985 to 2016. (Source: Helidoniotis et al, 2017a).
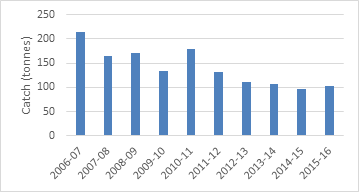
Figure 3 Trend in total catch
Risk Scores
|
Performance Indicator |
Gemfish – Eastern |
Gemfish – Western |
|
HIGH |
MEDIUM |
|
|
1A: Stock Status |
HIGH |
MEDIUM |
|
1B: Harvest Strategy |
PHR |
MEDIUM |
|
1C: Information and Assessment |
MEDIUM |
MEDIUM |
|
C2 ENVIRONMENTAL IMPACT OF FISHING |
LOW |
LOW |
|
LOW |
LOW |
|
|
2B: ETP Species |
MEDIUM |
MEDIUM |
|
2C: Habitats |
LOW |
LOW |
|
2D: Ecosystems |
LOW |
LOW |
|
C3 MANAGEMENT |
LOW |
LOW |
|
3A: Governance and Policy |
LOW |
LOW |
|
3B: Fishery-specific Management System |
LOW |
LOW |
Summary of main issues
- Most of the main stocks are well-positioned against Component 1 performance indicators, except for Eastern Gemfish where, despite recent years of low total catch, predicted recovery has not yet occurred.
- The fishery appears relatively well-placed against most of the Component 2 performance indicators, although there is uncertainty about whether existing arrangements are sufficient to ensure stock rebuilding for Blue Warehou and Eastern Gemfish.
- The fishery is well-positioned against P3 performance indicators.
Outlook
Gemfish – Eastern
| Component | Outlook | Comments |
| Target species | Uncertain ? | Stock projections suggest the stock should rebuild to the limit reference point by 2027, although recruitment levels have been below average in recent years and there is limited evidence of recovery to date. |
| Environmental impact of fishing | Stable = | Lower risk scores may be achieved with additional evidence that measures in place to ensure the CTS does not hinder recovery of ETP species are being implemented successfully. |
| Management system | Stable = | No major changes are expected to Component 3 PIs |
Gemfish – Western
| Component | Outlook | Comments |
| Target species | Uncertain | There are uncertainties around the Tier 1 and Tier 4 assessments for this stock, although catches have been stable in recent years and are low as a proportion of the RBC and below the Great Australian Bight catch trigger. Alternative assessment approaches are currently being explored. . |
| Environmental impact of fishing | Stable = | No major changes are expected to Component 2 PIs |
| Management system | Stable = | No major changes are expected to Component 3 PIs |
COMPONENT 1: Target species
1A: Stock Status
CRITERIA: (i)The stock is at a level which maintains high productivity and has a low probability of recruitment overfishing.
| (a) Stock Status – Eastern Stock |
HIGH RISK |
|
There are two distinct stocks of Gemfish in Australia, an eastern and western stock, separated by a boundary at the western end of Bass Strait (Colgan & Paxton 1997; Moore et al. 2016).
Catch of Gemfish in the eastern zone peaked at more than 6,000 t in 1978, and declined rapidly after 1987 (Helidoniotis et al, 2017a). The landed eastern zone catch in 2016-17 was 30.4t. An integrated stock assessment model for Eastern Gemfish was first developed in 2008 and was last updated in 2010 with data on catch and length frequency up to 2009 (Helidoniotis et al, 2017a). The estimates of spawning stock biomass did not differ greatly among years, with the base-case model estimating that the spawning stock biomass in 2009 was 15.6 per cent of the 1968 level (Figure 5). Helidoniotis et al (2017a) report that a preliminary tier 1 update on the 2010 assessment indicated that the spawning stock biomass in 2015 had decreased to 8.3 per cent (0.083SB0), likely as a result of a lack of recruitment. Given the most recent assessment estimated the stock to be below the limit reference point, Helidoniotis et al (2017a) concluded the stock remains overfished.
On that basis, the stock does not meet the medium risk SG and we have scored this SI high risk.
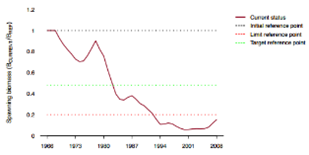
Figure 5: Estimated spawning stock biomass of Gemfish, eastern zone 1966 to 2008 (Source: Helidoniotis et al, 2017a)
| (a) Stock Status – Western Stock |
MEDIUM RISK |
|
A total of 73.3 t of western Gemfish was landed in 2016–17 (Helidoniotis et al 2017a). Historically, a substantial catch of western Gemfish was taken within the SESSF Great Australian Bight Trawl Sector (GABTS), however in recent years catch has been very limited due to a cessation of targeting rather than declines in abundance (Helidoniotis et al 2017a).
Helidoniotis et al (2017a) report that the western Gemfish stock was assessed using both Tier 1 and Tier 4 assessments in 2016, using data from 1986 to 2015. The tier 1 assessment updated the 2014 assessment and included updated data from both the CTS and the GABTS. Data included catch-and-effort data, and age error data. The estimated spawning biomass depletion for the CTS and the GABTS combined from the tier 1 assessment was 43 per cent (Figure 6). Helidoniotis et al (2017a) noted that varying discard rate changes in fishing grounds and the potential for hyperstability are not explicitly accounted for in the standardisation and may bias results if not accurately indexing abundance. Nevertheless, they concluded that the stock was neither overfished, nor subject to overfishing.
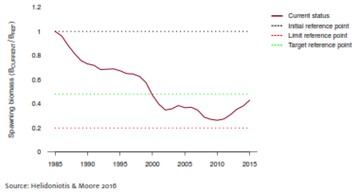
Figure 6: Estimated spawning stock biomass of gemfish, western zone, 1985 to 2015, for the CTS and the GABTS (Helidoniotis et al, 2017a)
GABRAG (2017) noted that the Tier 1 assessment outcomes were highly uncertain and recommended exploration of alternate assessment approaches. A Tier 5 (catch-MSY) assessment has recently been undertaken though outputs were not available.
In the absence of a robust Tier 1 assessment, GABRAG (2016) agreed to take a weight of evidence based approach to its recommendations on RBCs/TACs. They noted that although there was insufficient data to assess the likelihood of the stock declining below the limit reference point, considering the CTS (and SHS) RBC was between the upper and lower estimates from the Tier 4 assessment, there was little risk of the stock declining below the limit reference point.
Accordingly, given the very limited harvest of the stock and the weight of evidence suggesting the stock is unlikely to decline below the limit reference point, is appears at least likely that the stock is above the PRI. Nevertheless, there is insufficient certainty in the information to indicate the stock is fluctuating at or around levels consistent with MSY. On this basis, we have scored this SI medium risk.
PI SCORE – LOW RISK – Gemfish – Western
PI SCORE – HIGH RISK – Gemfish – Eastern
1B: Harvest Strategy
CRITERIA: (i)There is a robust and precautionary harvest strategy in place.
(a) Harvest Strategy
The CTS harvest strategy consists of:
- Limited entry;
- Catch controls through TACs and ITQs, set according to well-defined harvest control rules under the SESSF Harvest Strategy Framework (HSF; AFMA, 2017);
- Gear restrictions;
- Monitoring through logbooks and catch disposal records (CDRs);
- Monitoring through VMS;
- Monitoring through independent observers who provide estimates of discards; and
- Periodic assessments of stock status.
A harvest strategy framework (HSF) has been in place in the SESSF since 2005. The most recent version of SESSF Harvest Strategy was agreed in 2017 (AFMA, 2017a). The SESSF HS is designed to meet the objectives of the Commonwealth Fisheries Harvest Strategy Policy 2007 (HSP), namely “the sustainable and profitable use of Australia’s Commonwealth fisheries in perpetuity through the implementation of harvest strategies that maintain key commercial stocks at ecologically sustainable levels, and within this context, maximise the economic returns to the Australian community” (DAFF, 2007). To meet this objective, harvest strategies are designed to pursue an exploitation rate that keeps fish stocks at a level required to produce maximum economic yield (MEY) and ensure stocks remain above a limit biomass level (BLIM) at least 90% of the time. Alternative reference points may be adopted for some stocks to better pursue the objective of maximising economic returns across the fishery as a whole (AFMA, 2017a).
The following summary of the HSF structure and processes is adapted from AFMA (2017a):
The HSF uses a three tier approach designed to apply different types of assessments and cater for different amount of data available for different stocks. The HSF adopts increased levels of precaution that correspond to increasing levels of uncertainty about stock status, in order to reduce the level of risk associated with uncertainty. Tier 1 represents the highest quality of information available (i.e. a robust integrated quantitative stock assessment).
Each Tier has its own harvest control rule (HCR) that is used to determine a recommended biological catch (RBC). The RBCs provide the best scientific advice on what the total fishing mortality (landings from all sectors plus discards) should be for each species/stock. For all Tier levels, once the RBC is determined from the results of the assessment and the application of the relevant HCR, a recommended total allowable catch (TAC) is calculated based on the TAC setting rules.
For Tier 1, the HCR is based on the following reference points:
- The limit biomass BLIM –The default BLIM proxy is B20 = 20% of the unfished spawning biomass;
- The BMSY – the default BMSY proxy is B40 = 40% of the unfished spawning biomass;
- The target biomass BTARG (MEY) – BTARG is generally equal to BMEY, for which the default proxy is approximated by 1.2*BMSY. If the default BMSY proxy is used, this results in B48 = 48% of the unfished spawning biomass.
The Tier 1 harvest control rule applies to species and/or stocks where there is a robust quantitative assessment that provides estimates of current biomass levels, and where estimates or appropriate proxies are available for BLIM, BTARG and FTARG.
Tier 3 and Tier 4 assessments use other indicators (relating to fishing mortality and catch rates respectively) and reference points which are taken as proxies for the biomass reference points for Tier 1.
A Tier 3 stock assessment uses information available on the age structure of annual catches and annual total catch weight, as well as knowledge of basic biological parameters, e.g. natural mortality, length at age, weight at length, the stock recruitment relationship steepness, fecundity at age and selectivity at age. The catch control rule uses the ratio of the target exploitation rate to the actual exploitation rate as a multiplier on the current average catch to determine the RBC.
The Tier 4 assessment is based entirely on catch and CPUE. The Tier 4 analysis determines an RBC by selecting CPUE reference points that are taken as proxies for the estimated BLIM and BTARG. This is done by assuming that the CPUE is proportional to stock abundance, an assumption that is made in most SESSF assessments.
HCRs under each Tier of the HSF have been subject to robust simulation testing (e.g. Wayte, 2009) with results published in peer-reviewed journals (e.g. Little et al, 2011).
The status of fish stocks in the SESSF, and how they are tracking against the HSF, is reported to the relevant Resource Assessment Group (RAG), the relevant Management Advisory Committee (MAC) and AFMA Commission as part of the yearly TAC setting process. The data used for input into the stock assessment process are collected by the observer-based Integrated Scientific Monitoring Program (ISMP), AFMA logbooks and Catch Disposal Records (CDRs) and periodic trawl-based Fishery Independent Surveys (FIS). Otoliths from the biological sampling are provided to a private contractor for ageing. All sampling and age data are provided to stock assessment scientists for analysis or reporting. Stock assessment reports are produced by CSIRO or other contracted assessment specialists and discussed by the RAG. The outcomes of assessments are run against the HCRs in the HSF to produce recommended biological catch (RBC) amounts for each quota species. Other sources of mortality, including an estimate of future discards, catch taken by other jurisdictions (e.g. State and recreational sectors) and a research catch allowance, are subtracted from the RBC to produce a Commonwealth TAC.
Each stock is assessed under the appropriate Tier level as advised by the RAGs. In mid-December, AFMA produces a position paper with recommended TACs for quota species for the upcoming fishing season, based on the stock assessments and RAG advice. The paper is distributed to interested parties and undergoes a public comment period.
In early February, a South East Management Advisory Committee (SEMAC) TAC Setting meeting is held where TAC recommendations are made. The outcomes of RAGs and SEMAC together with the AFMA position paper and any public comments received, are then sent to the AFMA Commission to determine TACs for the upcoming fishing season in mid-February.
| Gemfish – Eastern |
PRECAUTIONARY HIGH RISK |
|
The integrated stock assessment model (tier 1) for Eastern Gemfish was last updated in 2010 (Little and Rowling, 2010), with spawning stock biomass estimates of 15.6% of the 1968 level (0.156 SB0). The 2010 assessment provided biomass projections based on two scenarios: total catches of 0 and 100 t each year. The projection for zero catch suggested that the biomass might reach 0.20 SB0 (the limit reference point, LRP) before 2020, while projections for annual catches of 100 t reached the LRP in 2025 (Little and Rowling, 2010).
The 2008 Eastern Gemfish rebuilding strategy adopted a time frame of nine years to reach the LRP, however given poor recent recruitment AFMA believed that this timeframe was unlikely to be met (AFMA, 2015a). The updated 2015 rebuilding strategy has adopted the rebuilding timeframe of one mean generation time plus 10 years (approximately 19 years from 2008), which is in line with the HSP. The rebuilding strategy aims to rebuild Eastern Gemfish to, or above, the limit reference point by 2027.
Once rebuilt to the limit reference point, the rebuilding strategy aims to rebuild the stock to the default BMSY reference point of B40, and then to the BMEY reference point of B48 (AFMA, 2015a). No target timeline is provided for rebuilding to the BMSY level.
The rebuilding strategy provides for zero targeted catch, but allows for an incidental take of 100t. The incidental take limit of 100t has been in place since 2002 (AFMA, 2015a). Additional fishing mortality may arise from discarding, which is estimated through observer coverage. The incidental catch TAC level is reviewed by SERAG annually and may be increased or decreased depending on information about targeting behaviour or changes to fishing mortality and biomass.
Additional measures in the rebuilding plan which serve to limit exploitation include increasing codend mesh size (minimum of 90 mm mesh size), deepwater spatial closures (introduced to limit exploitation of upper slope dogfish species, but will also offer some protection to eastern Gemfish) and compulsory pre-reporting for fishers landing eastern gemfish during the species annual spawning migration (to allow for data collection) (AFMA, 2015a).
In addition to the rebuilding strategy, an industry Code of Practice is in place through the South East Trawl Fishing Industry Association (SETFIA), which encourages fishers to actively avoid catching eastern gemfish and highlights the importance of accurately recording data. The Code also includes a measure asking fishers to communicate the location of large shots of eastern Gemfish to others in an effort to increase avoidance and reduce incidental catches. The development of the Code saw a reduction in the total fishing mortality (catch and discards) by approximately a third between 2010 to 2011 (AFMA, 2015a).
SERAG (2016) notes that total fishing mortality (retained catch plus discards) in Commonwealth fisheries was below the incidental TAC in 2012, 2014 and 2015. Helidoniotis et al (2017a) also report that the total fishing mortality was 77.4t in the 2016-17 fishing year, which is below the incidental TAC. However, discards in 2013 were around 131t and, together with retained catches, meant the total fishing mortality was around double the incidental TAC. On the basis that recent catch history includes years when the incidental catch allowance was exceeded, indicating that management arrangements may not be sufficient to limit fishing mortality, Helidoniotis et al (2017a) classified the stock as ‘uncertain if subject to overfishing’.
Eastern Gemfish are also taken by dropline fishers in the NSW Ocean Trap and Line Fishery (OTLF) (Chick, 2015). Fishers are subject to a 50kg/trip limit, with reported catches between 2009-10 and 2013-14 ranging from 10-20t. More recent commercial catch information was not found. Landings by recreational fishers have previously been estimated at 10t (Henry and Lyle, 2003), although no more recent estimate is available. Chick (2015) notes that the catch in the NSW charter boat sector is likely to be ‘significant’ although total catches are not provided. The charter sector is subject to a 10 fish per boat limit. AFMA (2015a) notes that recreational and NSW commercial catch have the potential to impact on recovery times, however estimates of catch from both of these sectors are unreliable and need improvement (AFMA, 2015a).
SERAG (2016) noted that despite a long period of management under the rebuilding strategy there is no evidence of any stock rebuilding. In practice, rebuilding appears to be constrained by poor recruitment. While a relatively strong recruitment event occurred in 2002, recruitments during the last 25 years have been relatively weak which contrasts with the 1970s when recruitment was variable, but generally higher (Little and Rowling, 2010).
In essence then, a harvest strategy is in place to recover the stock to the limit reference level (and then ultimately to the BMEY target level). Assessment modelling indicates that, under average recruitment conditions and at a 100t catch, the stock should recover to the limit reference level by 2025. Catches within Commonwealth fisheries have been largely compliant with incidental catch limits, although there was a considerable overrun in one recent year. Catches in NSW fisheries are likely to be smaller but data are uncertain. Collectively, there is some probability that Commonwealth and State catches exceed the 100t allowance modelled in the most recent stock assessment. Little and Rowling (2010) cautioned that the projection of the stock recovering to the limit reference point by 2025 under the 100t catch limit noted that the “depends strongly on the average recruitment operating for the stock in the future (which has not occurred in recent years) and whether catches exceed the bycatch limit”.
While there is some argument that the harvest strategy will achieve the stock management objectives reflected in criteria 1A(i) over time, there is uncertainty around whether the objectives will be achieved primarily as a result of poor recruitment, but also as a result of uncertainty in some catch data. Given the overfished state of the stock, we have scored this SI high risk. The UoA would be better placed with stronger information on total catches across the stock and some evidence of recovery.
| Gemfish – Western |
MEDIUM RISK |
|
Management of the western Gemfish stock is complex with catches taken across multiple sectors. The SHS harvest is managed under the SESSF TAC, but may be taken in the Western Bass Strait (WBS) or the Great Australian Bight (GAB). The stock is also accessed by the Commonwealth Trawl Sector, whose catches are also managed within the SESSF TAC, but may only be taken within the WBS. The SESSF TAC for the 2016-17 fishing season was 247t. Catches are also taken in the GAB Trawl Sector (GABTS) for which there is no TAC. Whereas western Gemfish are targeted in the CTS, incidental catches in the GABTS are more common. Catches in GABTS are in addition to the SESSF TAC and are subject to a trigger point in the SESSF HSF which requires a full assessment to be undertaken if catch exceeds 1000 t over three years (AFMA 2017a).
Combined catches in Commonwealth fisheries in 2016-17 were 73.3t, with discards estimated at around 63t. This was well below the RBC of 247t.
The main uncertainties in the harvest strategy are the state of the stock itself given the uncertainty in assessments (GABRAG, 2017), and the potential for unconstrained catches in the GABTS to undermine the effectiveness of catch constraints in the CTS and SHS. Given the uncertainties over stock status, it is not clear that the harvest strategy is directly responsive to the state of the stock. Nevertheless, given catches across all sectors are closely monitored, catches in the GABTS are subject to a formal review if they exceed a predefined level and averaged only 29t between 2011 and 2015, and uncertainty is taken into account in recommending RBCs and TACs in the non-GABTS sectors, there is a plausible argument that the harvest strategy is expected to achieve the stock management objectives reflected in criterion 1A(i). Accordingly, we have scored this SI medium risk.
(b) Shark-finning
NA
CRITERIA: (ii) There are well defined and effective harvest control rules (HCRs) and tools in place.
| (a) HCR Design and application |
LOW RISK |
|
Well-defined HCRs are set out for each Tier 1-4 species covered by the SESSF HSF (AFMA, 2017a). HCRs are designed to achieve the objectives set out in the HSF which in turn has been designed to meet the Commonwealth HSP (DAFF, 2007).
Under the HSF, for Tier 1 stocks the target fishing mortality rate FTARG represents the fishing mortality rate that would result in a spawning biomass of BTARG (equal to BMEY). The default value for FTARG is F48, the value of F corresponding to a BTARG of B48. Alternative reference points may be adopted for some stocks to better pursue the objective of maximising economic returns across the fishery as a whole. The recommended maximum fishing mortality rate for Tiers 3 and 4 is FMSY (the default proxy for which is F40). This represents the fishing mortality rate that would cause the spawning biomass to decline to its maximum sustainable biomass BMSY (the default proxy for which is B40). The breakpoint, or HCR inflection point, in the overfishing line occurs at a biomass corresponding to BMSY. If B<BMSY or F>FMSY, the TACs should be reduced to limit fishing effort and the fishing mortality rate. For Tier 1, the recommended maximum fishing mortality rate and HCR inflection point occurs at a proxy of F35.
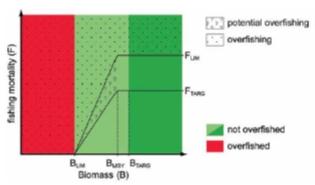
Figure 8: Schematic representation of a harvest control rule, showing key reference points (Source: AFMA, 2017)
Recommended Biological Catch (RBC) is calculated according to the following (AFMA, 2017a):
Tier 1
The formula for calculating FTARG is as follows:
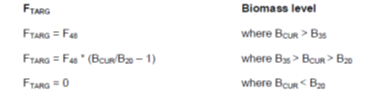
The RBC is calculated by applying FTARG to the current biomass BCUR to calculate the total catch (including discards) in the next year, using the agreed base case assessment model:
![]()
At Tier 1, BLIM = B20, the maximum value for FTARG = F48 and the breakpoint in the HCR occurs at B35. Alternative reference points may be adopted for some stocks to better pursue the objective of maximising economic returns across the fishery as a whole.
The HCRs are robust to the main uncertainties (SI(b)) as they have been developed over a period of time involving world leading scientists, underpinned by publications in peer-reviewed journals. There is substantial evidence that the HCRs have been successfully implemented across a diverse range of gear types and species of Commonwealth fisheries (SI(c)). Additional HCRs are also applied for specific fisheries or species where necessary, developed through the Resource Assessment Group, and applied and monitored by AFMA.
Tier 3
The Tier 3 HCR applies to species and/or stocks that do not have a quantitative stock assessment, but where estimates of fishing mortality and other biological information are available (AFMA, 2017a). Yield per recruit calculations are used to calculate F values that will reduce the spawning biomass to 20% (F20), 40% (F40) and 48% (F48) of the unexploited level.
Recommended biological catch CRBC is calculated according to the following formula:

where FCUR is the estimated current fishing mortality, and FRBC is the selected F for the recommended biological catch from the control rule. The estimate of fishing mortality is limited to be no less than 0.1 of natural mortality.
Tier 4
The Tier 4 control rule is of the form:
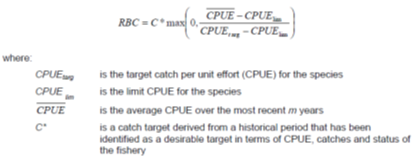
A range of considerations are then taken into account in translating the RBC into a TAC. For Tier 4 species a ‘discount factor’ of 15% is applied to account for greater levels of uncertainty in these stocks. Other sources of mortality including state catches, discards and any research catch allowance are then subtracted from the RBC to produce a Commonwealth TAC.
Multi-year TACs are to be applied for all Tier 1 and Tier 4 species where suitable. Where the RBC is zero, an incidental bycatch TAC may be set after considering a range of circumstances including the impact of incidental catches on rebuilding of the stock.
| Gemfish – Eastern | MEDIUM RISK |
The eastern stock of Gemfish is currently below the limit reference point and subject to a formal rebuilding strategy. The strategy aims to recover the stock to the limit reference point of B20 by 2027 (one mean generation time plus 10 years), and from there ultimately to the target reference point of B48 (AFMA, 2015a). The stock is formally listed as a Tier 1 stock under the HSF. The most recent stock assessment was completed in 2010, with targeted catch set at zero consistent with the Tier 1 HCR. Key uncertainties in the operation of the HCRs are the capacity to undertake robust Tier 1 assessments given recent catch rates cannot be used as a reliable index of abundance due to avoidance behaviour of operators (SERAG, 2016), and the appropriateness of current limits under lower than average recruitment conditions which have been persistent in recent years. The HCR also does not include State catches which are uncertain. While a well-defined HCR exists and serves to control exploitation, it is not clear that it is robust to these main uncertainties. Accordingly, we have scored this SI medium risk.
| Gemfish – Western | MEDIUM RISK |
There are effectively two types of HCR which apply to Commonwealth fisheries accessing the western Gemfish stock: the Tier 1 HCR applying to TACs for the CTS and SHS and the catch trigger applying to the GABTS. While the Tier 1 HCR is a well-defined HCR which ensures that exploitation is reduced as PRI is approached and could be expected to keep the stock fluctuating around levels consistent with MSY, Tier 1 assessments of the western Gemfish stock are currently highly uncertain (GABRAG, 2017). In practice, a weight of evidence based approach taking into account the outcomes of Tier 1 and Tier 4 assessments and recent catch history has been used to recommend RBCs and TACs (GABRAG, 2016). In the GABTS, the current trigger point in HSF is more consistent with a generally understood HCR which is available to the management agency. While tools are available to the management agency to reduce exploitation in the GABTS (e.g. quota), these are not yet in place. Accordingly, we have scored this SI medium risk.
PI SCORE – MEDIUM RISK – Gemfish – Western
PI SCORE – HIGH RISK – Gemfish – Eastern
1C: Information and Assessment
CRITERIA: (i) Relevant information is collected to support the harvest strategy.
| (a) Range of information |
MEDIUM RISK |
|
Comprehensive information on fleet composition, catch and other fishery-wide indicators is collected through the monitoring programs described in AFMA (2017a). In 2016-17 fishing season there were 57 trawl vessels in the CTS, although only 34 were active (Helidoniotis et al, 2017a). Catch data are collected through compulsory logsheets and catch disposal records.
There is sufficient information to suggest there are two biologically distinct stocks of Gemfish in Australia: an eastern stock and a western stock, separated by a boundary at the western end of Bass Strait (Colgan & Paxton 1997; Moore et al. 2016). Eastern Gemfish are distributed from Cape Moreton, southern Queensland, along the east coast to Bass Strait and the waters off Tasmania. Western Gemfish are distributed from Ningaloo Reef and Geraldton through the Great Australian Bight (AFMA 2015a). Eastern Gemfish are mesopelagic and inhabit waters from 100 m to 700 m but are generally found at 250 m – 500 m deep. They are generally caught close to the sea floor but the fish are likely to move into mid-water at times (Kailola et al. 1993; Pogonoski et al. 2002). Their life history characteristics are well understood and are summarised in the 2015 Eastern Gemfish Rebuilding Strategy (AFMA 2015a).
The composition of the fleet and the distribution of the catch are very well understood, particularly for Eastern Gemfish in recent years when efforts to reduce potential targeting have required scrutiny of catch and effort data to the vessel level.
The current harvest strategy is based around limiting fishing mortality to a 100t incidental mortality limit to allow the stock to rebuild to the limit reference point by 2027 (AFMA, 2015a). While catches and discards in Commonwealth fisheries are relatively well understood, AFMA (2015a) notes that information on catches from NSW commercial and recreational fisheries are unreliable and require improvement. Given the sensitivity of rebuilding targets to constraining catches with the bycatch limit, we have scored this SI medium risk on the basis that current information may not be sufficient.
Good information exists on stock structure and fleet composition for the western Gemfish stock. Catches and effort are estimated across the main fleets and some information on discarding is available through the ISMP. However, GABRAG (2016) noted considerable uncertainty exists in the CPUE data and discarding and there have been challenges in collecting representative data in the GABTS to support stock assessments given the very low levels of effort. These have meant that Tier 1 assessments are unreliable. Moreover, Tier 4 assessments are highly senstive to the inclusion of discards. Accordingly, while some information is available to support the harvest stratgey, consistent with medium risk, at this stage information is insufficient to support the Tier 1 HCR.
| (b) Monitoring and comprehensiveness |
LOW RISK |
|
Generic monitoring arrangements in place for the SESSF are described in the HSF (AFMA, 2017). These include:
Logbooks and catch records
AFMA requires fishers to record catch and effort information in logbooks at sea, and in catch disposal records (CDRs) which record the actual landed catch at port. CDRs are considered more accurate than logbook records. Data recorded for each fishing operation includes: the port and date of departure and return; gear type and fishing method; number of fish kept and discarded; and resultant catch and product form (e.g. trunked, gutted, filleted, whole).
The Integrated Scientific Monitoring Program (ISMP)
A key component of the ISMP is the sampling and recording of catches at ports and on board fishing vessels using fishery-independent observers. The purpose of the ISMP is to provide reliable, verified and accurate information on the fishing catch, effort and practice of a wide range of vessels operating inside and, periodically, outside the Australian Fishing Zone. Biological and environmental data are collected on: catch composition including size and weight; amount and type of incidental catch; number of fish kept and discarded; fate of target and non-target species; interactions with TEP species; and fishing effort.
Fishery Independent Surveys (FIS)
The FIS is an industry-based fishery-independent resource survey which provides a timeseries of relative abundance indices for key target species (e.g. Knuckey et al, 2015). A FIS has been conducted for key target species in the SESSF since 2008. Biological and environmental data are collected such as: target species; catch rate (kg/shot); fishing method; and fishing depth. Information which provides a relative abundance index of other main byproduct and incidental catch species is also obtained.
Stock abundance is monitored through models of varying sophistication based on data availability for Tier 1, 3 and 4 species. All UoA removals, including state catches and discards, are estimated in TAC decision making.
Accordingly, for all Tier 1-4 species stock abundance and UoA removals are regularly monitored at a level of accuracy and coverage consistent with the HCR and there is good information on all other removals from the stock.
The Tier 1 HCR in place for Eastern Gemfish under the HSF means the target catch levels have been set at zero, with a 100t incidental catch allowance. This is consistent with the rebuilding strategy. Stock abundance has not been monitored regularly because recent catch rates cannot be used as a reliable index of abundance due to avoidance behaviour of operators (SERAG, 2016). Nevertheless, one at least one indicator (catch) is monitored in the context of previous stock assessment results indicating the stock should rebuild to the limit level by 2025 at 100t catch. In Commonwealth fisheries, removals from the stock (retained and discards) are monitored against the incidental catch allowance. Nevertheless, information on commercial and recreational catches in NSW is less comprehensive (AFMA, 2015a). Accordingly, there is not good information on all other removals from the stock and we have scored this SI medium risk.
Stock abundance in the western Gemfish stock has been monitored through periodic Tier 1 and Tier 4 assessments, although there is considerable uncertainty in the outputs (GABRAG, 2016; 2017). Much of the available information support stock assessments comes from the CTS; catches are low in the GABTS so catch rate analysis is generally not informative. Existing assessment outputs have insufficient certainty to support either Tier 1 or Tier 4 HCRs, so a weight of evidence based approach has been used to set TACs, taking into account the outcomes of both Tier 1 and Tier 4 assessments and recent catch history (GABRAG, 2016). Removals from the main sectors (CTS, SHS, GABTS) are monitored, including estimates of total discards. Given some estimate of relative risk to the stock has been assessed in the context of the requirements of the SESSF HSF, and removals are monitored, we have scored this SI medium risk
CRITERIA: (ii) There is an adequate assessment of the stock status.
| Gemfish – Eastern |
MEDIUM RISK |
Eastern Gemfish is managed as a Tier 1 species with an integrated stock assessment model last updated in 2010 (Little and Rowling, 2010). Spawning stock biomass was estimated at 0.156 SB0, with biomass projections based on a scenario of zero catch and 100 t catch per year. The assessment is appropriate for the stock and estimates status relative to reference points in the HSF. Nevertheless, the age of the assessment model (i.e. 2010) means there is some uncertainty around the extent to which the outcomes reflect current stock status. Moreover, given changes in the characteristics of the fishery (e.g. avoidance behaviour by fishers and low levels of catch) there is uncertainty around the usefulness of some previously used indices (e.g. CPUE). Nevertheless, the exitsing model together with other information (e.g. incidental catch levels) has been sufficient to assign a status relative to generic reference points (e.g. overfished/not overfished). Accordingly, this SI is scored as medium risk.
| Gemfish – Western |
MEDIUM RISK |
An integrated stock assessment model (tier 1) was developed for western Gemfish in the CTS and the GABTS in 2011, and was last updated in 2016 (GABRAG, 2016). The model was run using the most recent version of Stock Synthesis and incorporated new CPUE, age and length data. GABRAG noted the CPUE data used to inform the assessment was unreliable and there were a range of other uncertainties (e.g. length frequency sampling is unrepresentative, the small volume fish being caught in the GABTS is likely to be unrepresentative of the western Gemfish resource in the GAB) (GABRAG, 2016). Standardised CPUE-based Tier 4 assessments have also been completed for the stock although these are highly sensitive to the inclusion of discards. Given the uncertianties in current assessments, a Tier 5 assessment was explored in 2017 although outputs were not presented (GABRAG, 2017).
In light of the uncertainties in Tier 1 and Tier 4 assessments, GABRAG (2016) used a weight of evidence based approach to assess the generic risk of current levels of fishing mortality on the stock and concluded that there was little risk of the stock declining below the limit reference point. To that end, notwithstanding uncertainties in the available assessments, the existing information has been sufficient to estimate status against generic reference points which appropriate to the stock. Accordingly, we have scored the stock medium risk. Nevertheless, we note the UoA would be substantially better placed against this SI with a more reliable assessment.
(b) Uncertainty and Peer review
Stock assessments for all Commonwealth managed stocks are subject to peer review and judgement (i.e., ability to reject the assessment) in the relevant Resource Assessment Group (RAG) and the South East Management Advisory Committee (SEMAC).
| Gemfish – Eastern |
MEDIUM RISK |
Eastern Gemfish are subject to a Rebuilding Strategy that requires annual assessment and review. The Eastern Gemfish stock assessment identifies and takes into account the main sources of uncertainty, albeit that the assessment is now eight years old. Key uncertainties in more recent data (e.g. avoidance behaviour by fishers is likely to mean catch rate data is unreliable) are identified in generic assessments of stock status (i.e. overfished/not overfished) but have not been taken into account in a more recent assessment
| Gemfish – Western |
MEDIUM RISK |
Uncertainties in the existing Tier 1 and Tier 4 stock assessments have been identified, but not yet taken into account. A Tier 5 assessment was explored in 2017 (GABRAG, 2017).
PI SCORE – MEDIUM RISK
COMPONENT 2: Environmental impact of fishing
2A: Other Species
CRITERIA: (i) The UoA aims to maintain other species above the point where recruitment would be impaired (PRI) and does not hinder recovery of other species if they are below the PRI.
| (a) Main other species stock status |
MEDIUM RISK |
|
The intent of this scoring issue is to examine the impact of the fishery on ‘main’ other species taken while harvesting the target species. ‘Main’ is defined as any species which comprises >5% of the total catch (retained species + discards) by weight in the UoA, or >2% if it is a ‘less resilient’ species. The aim is to maintain other species above the point where recruitment would be impaired and ensure that, for species below PRI, there are effective measures in place to ensure the fishery does not hinder recovery and rebuilding.
In this assessment, main other species are assessed as those species that —
- constitute > 5% of the catch (by weight) or constitute > 2% of the catch and are ‘less resilient’; or
- were assessed as at least precautionary high risk during the Level 3 SAFE ERA (Zhou et al. 2012).
Species that constitute >5%, and >2% of the catch
Observer data indicates that otter trawlers directly interact with 533 species, 360 of these are teleosts, 39 are skates/rays and 63 are sharks (Walker et al., 2006). However, the fishery regularly retains around 30 target species and over 100 byproduct species. Knuckey and Upston (2013) report that “varying, but significant, levels of the catch (up to 50% by weight of quota and non-quota species combined) are caught and discarded in the “market” fishery. Although some commercial species are discarded, most of the discards are comprised of small fish species with little or no commercial value”.
Average annual retained catch in the CTS (inclusive of the Danish seine sector) during the three year period between 2013 and 2015 was 10,604t, based on catch disposal records. Species accounting for >5% of the retained catch, and not assessed here as target species, include Tiger Flathead (24.1%) and Eastern School Whiting (6.3%). Others which account for >2% of the retained catch include Silver Warehou (4.4%) and Mirror Dory (2.5%), although neither of these are likely to be considered ‘less resilient’ and both have recently been classified as neither overfished, nor subject to overfishing (Helidoniotis et al, 2017a). Eastern School Whiting are caught almost entirely by the Danish Seine sector of the CTS and thus do not need to be assessed here. Accordingly, we have assessed Tiger Flathead as a main other species, noting that all other species have been assessed through the SESSF ERA process discussed below.
Flathead
For SESSF management purposes, ‘flathead’ refers to a group of at least eight flathead species consisting predominantly of tiger flathead (Platycephalus richardsoni), but sand flathead (P. bassensis), southern flathead (P. speculator), bluespot flathead (P. caeruleopunctatus) and gold-spot or toothy flathead (P. aurimaculatus) are also caught regularly. Tiger flathead remains the dominant species in the catch and is the only species assessed in stock assessments at this stage. Data from onboard observers support catch data and indicates that P. richardsoni comprises over 95% of the SESSF catch of flathead (Morison et al. 2013); the results of aproductivity-susceptibility analysis suggest that the productivity of Tiger Flathead is not significantly different to the other five species regularly encountered. It is therefore reasonable to assume they won’t be disproportionately impacted by stock management arrangements directed at tiger flathead.
The most recent assessment of flathead estimated spawning stock biomass in 2014 to be 11 572 t or 50 per cent of the unfished (1915) level (Day & Klaer, 2014). The spawning biomass that supports maximum sustainable yield of Tiger Flathead was estimated to be 32 per cent of the unfished biomass. The biological stock is not considered to be recruitment overfished (Helidoniotis et al, 2017a). The available evidence indicates that the stock is highly likely to be above PRI.
Species assessed as at least precautionary high risk during the Level 3 SAFE ERA (Zhou et al. 2012).
Seventeen species or species groups were assessed as at least precautionary high by Zhou et al. (2012). A subsequent analysis demonstrated that the SAFE assessment significantly overestimated the risk to Bight skate, with the risk reduced from Extreme High Risk to Medium risk following an improved, data-intensive methodology (Zhou et al. 2013). However, given that some uncertainty still remains on the stock status of 16 other species, the measures in place to ensure the UoA does not hinder recovery or rebuilding are considered here.
It is worth noting that this assessment evaluates ‘other species’ across the CTS as a whole. Future assessments may benefit from greater depth and spatial separation of other species to account for the differences in other species catch composition across different areas and depth zones in the fishery.
AFMA employs an Ecological Risk Assessment for the Effects of Fishing (ERAEF) process for each Commonwealth fishery to determine risks posed by fishing to individual species. These outcomes are used here as a proxy for status of main other species in relation to PRI. Under the assessment framework used for this risk assessment, where there is evidence that a species/stock may be below PRI, measures must in place that are expected to ensure that the UoA will not hinder recovery and rebuilding for the UoA to meet the medium risk SG.
The AFMA ERAEF is a four step process:
- Level 1 analysis (SICA – Scale Intensity Consequence Analysis)
- Level 2 analysis (PSA – Productivity Susceptibility Analysis)
- Level 2 analysis (Residual risk PSA)
- Level 3 analysis (SAFE – Sustainability Assessment for Fishing Effects)
The first SAFE assessment was conducted in 2007 (Zhou et al. 2007). From this and previous Level 1 and Level 2 analyses, a Level 2 Residual Risk Assessment (AFMA 2012a) was published. The ERM identified a priority list of species to be assessed by the fishery, defined as those that were precautionary high risk or greater from the Level 2 and Level 3 assessments. In 2012, an updated SAFE assessment was completed (Zhou et al. 2012) for the CTS that identified a suite of additional species, including main other species, as precautionary high risk or greater risk. In 2014, residual risk guidelines were applied to the outcomes of the 2012 SAFE assessment for all teleost and chondrichthyan species (AFMA, 2014b).
At the completion of this process, a final list of 9 non-ETP species were identified as priorities to be treated through the SESSF Ecological Risk Management (ERM) Strategy 2015 (AFMA, 2015c) (Table 4).
Table 4: Priority species for the CTS identified through the ERA process (AFMA, 2015c).
| Common name | Species name | Highest level of Assessment | Risk rating |
| Dipturus australis | Common Skate | Level 3 SAFE | Extreme High Risk |
| Squalus mitsukurii | Green-Eyed Dogfish | Level 3 SAFE | (Greeneye spurdog listed as Extreme High Risk) |
| Azygopus pinnifasciatus | Righteye Flounder | Level 3 SAFE | Precautionary Extreme High Risk |
| Dipturus canutus | Grey Skate | Level 3 SAFE | Precautionary Extreme High Risk |
| Urolophus sufflavus | Yellow-backed Stingaree | Level 3 SAFE | Precautionary Extreme High Risk |
| Hydrolagus lemurs | Bight Ghost Shark | Level 3 SAFE | High Risk |
| Trygonorrhina fasciata | Eastern Fiddler Ray | Level 3 SAFE | High risk |
| Centrophorus squamosus | Nilson’s Deepsea Dogfish | Level 3 SAFE | Precautionary High Risk |
| Ventrifossa nigrodorsalis | Rattail | Level 3 SAFE | Precautionary High Risk |
While there is uncertainty about the current status of the high-risk species in relation to PRI, the CTS has a number of measures in place to monitor, assess and manage impacts. These are outlined in the SESSF Ecological Risk Management (ERM) Strategy (AFMA, 2015c). These include:
- Overall effort limitations through TACCs on main target species (Pitcher et al [2015] estimated around 6% of the continental shelf and slope area in the South East Marine Region [SEMR] was exposed to trawl effort annually);
- Spatial closures through both fisheries and marine parks legislation – in 2007, a network of 13 marine protected areas was declared in the South-east marine region, with reserves that cover an area of 388,464 km2 across a depth range of 40m – 4600m;
- Species specific measures including:
- Upper-Slope Dogfish Management Strategy which includes:
- a prohibition on the take of Harrisson’s dogfish and southern dogfish (ETP species);
- area closures (see AFMA, 2012b, 2015c);
- monitoring obligations through observers or electronic monitoring;
- a limit for bycatch of Harrisson’s and southern dogfish when undertaking permitted types of line fishing in specific areas: and
- handling practices to improve post capture survival for released sharks.
- Shark and Ray Handling Practices: A Guide for Commercial Fishers in Australia – the shark handling guide was developed by AFMA to improve the handling of non-target shark species and to provide background material on fisheries related injuries and research on survivability.
- National Plan of Action for the Conservation and Management of Sharks
- Fishery-specific spatial closures – AFMA (2015c) list 5 fishery-specific area closures for dogfish, and a further 11 closures for protection of: school and gummy shark habitats and breeding stock, Orange Roughy stocks, white sharks, Australian Sea Lions, juvenile scalefish, various endemic species and important habitats; and
- Periodic ecological risk assessments of all non-quota species taken in the fishery.
Accordingly, while there remains some uncertainty on the status of nine non-ETP species assessed as high risk or greater by AFMA (2014b) in relation to PRI, the fishery has measures in place that could be expected to ensure the UoAs do not hinder recovery and rebuilding if necessary. The strong recent history of the management agency in taking action to address known high risk areas (e.g. dogfish closures, nil TACs, etc) provides some confidence that the outcomes of the ERA process will be acted on. Further, ongoing improvements in the ERA methodology have resulted in the downgrading of risk ratings to at least some species (e.g. Bight skate) as more information is known, and application to other high risk species may produce similar results (Zhou et al, 2013). On this basis, the UoAs meet the medium risk SG.
CRITERIA: (ii) There is a strategy in place that is designed to maintain or to not hinder rebuilding of other species
| (a) Management strategy in place |
LOW RISK |
|
AFMA has a comprehensive strategy in place to manage the impacts of the fishery on both target and non-target species.
The SESSF Management Plan 2003 sets out clear objectives for the management all species impacted by the fishery (i.e. that the fishery is “conducted in a manner consistent with the principles of ecologically sustainable development and the exercise of the precautionary principle and, in particular, the need to have regard to the impact of fishing activities on non-target species and the long-term sustainability of the marine environment”), as well as actions by which the objectives will be achieved. In relation to non-target species these include:
- Monitoring through a structured program, the impact of fishing on fish species, any other species that are caught as by-catch, ecologically-related species and the marine environment, analysing the impacts and implementing any strategies necessary to ensure: (i) the sustainability of those species and the marine environment; and (ii) that by-catch limitations are not exceeded;
- periodically checking the accuracy and consistency of information kept in relation to the fishery
For commercially-important species managed under quota, a HSF is applied which establishes evidence-based catch limits according to a clear framework of reference points and harvest controls rules (AFMA, 2017a). Evidence-based RBCs and TACs are set based of regular stock assessments, with additional precaution built into the TAC setting process for stocks for which information is limited. Flathead is managed as a Tier 1 species under the HSF. The strategy is expected to maintain the stock at levels which are highly likely to be above the PRI.
For all other species, AFMA assesses the potential impact of the fishery through the application of the ecological risk assessment process described under criterion 2A(i)(a) above. In addition, in the SESSF, the level 3 SAFE assessment was extended by Zhou et al. (2013) to provide a greater understanding of the cumulative risk posed by multiple fisheries accessing the same species. A Residual Risk Assessment was also undertaken on the Level 3 SAFE outcomes (AFMA, 2014b).
Species identified as high risk through the ERA process are subject to specific management measures to better understand or limit impacts under the SESSF ERM Strategy (AFMA, 2015c).
In the future, measures to manage impacts on non-target species will be guided by the AFMA Bycatch Strategy 2017-2022 (AFMA, 2017b).
Measures in place to monitor and manage impacts on non-target species in the CTS include:
- Limited entry;
- Catch controls through TACs and ITQs;
- Gear restrictions (e.g. >90mm single mesh twine);
- Bycatch reduction devices;
- Monitoring through logbooks and catch disposal records (CDRs);
- Monitoring through VMS;
- Observer coverage through the ISMP;
- Spatial closures; and
- Depth closures (although they are currently in review).
The harvest strategy framework, the ERA process, and the implementation of on-water actions through the SESSF ERM Strategy is likely to be considered as at least a partial strategy that is expected to maintain or to not hinder rebuilding of the main other species at/to levels which are highly likely to be above the PRI.
| (b) Management strategy evaluation |
MEDIUM RISK |
|
For flathead, Tier 1 assessments estimating the stock to be above target levels provide an objective basis for confidence that the strategy in place will work.
For species identified as high risk through the ERA process, the SESSF ERM Strategy 2015 (AFMA 2015c) provides the framework for addressing impacts. These measures have been developed in consultation with SEMAC and other experts (e.g. CSIRO) as necessary. The measures are considered likely to work based on plausible argument, and therefore meet the medium risk SG, although for many there is yet to be an objective basis for confidence that the strategy will work and is being implemented successfully.
| (c) Shark-finning |
LOW RISK |
|
Shark finning at-sea is illegal in Commonwealth fisheries. All fisheries are subject to Fisheries Management Regulation 9ZO that makes it an offence for the caudal lobe, caudal fin, pectoral fin and dorsal fin to be removed from the shark at sea before it is in the possession of a fish receiver. Existing levels of observer coverage (129 days in 2016-17) and compliance monitoring is probably sufficient to verify the absence of shark finning to low risk levels.
| (a) Information |
LOW RISK |
|
The CTS is a multi-species fishery with numerous target species. AFMA’s ERA process, in addition to information provided through daily catch and effort logbooks, catch disposal records, protected species reporting, observer monitoring and VMS monitoring provides quantitative information to assess the UoA related mortality on other main species, and to support a management strategy. Observers collect detailed information on boat activity catch composition, as well as collection of data and samples for research programs and monitoring compliance of the boat with its fishing concession. Observer coverage rates are developed by AFMA in association with the RAGs. In 2016-17, observer coverage was 129 sea days, allocated across different geographical regions and times of the year (Helidoniotis et al, 2017a).
The risks that the otter trawl sub-fishery of the CTS poses to the sustainability of the marine ecosystem have been assessed through the application of a progression of risk assessment methodologies listed below:
- 2008 – ERA for effects of fishing completed to Level 2 Productivity Susceptibility Analysis (PSA) for non-teleost and non-chondrichthyans, habitats and communities, and to Level 3 Sustainability Assessment of Fishing Effects (SAFE) for all teleost and chondrichthyan species.
- 2010 – Application of residual risk guidelines to Level 2 PSA results for all non-teleost and non-chondrichthyan species.
- 2012 – Re-assessment by application of residual risk guidelines to Level 2 PSA results for non-teleost and non-chondrichthyan species; re-assessment of Level 3 SAFE for all teleost and chondrichthyan species.
- 2014 – Application of residual risk guidelines to Level 3 SAFE results for all teleost and chondrichthyan species.
Further information is available in the SESSF ERM Strategy (AFMA, 2015c).
Notwithstanding uncertainties around the population status of some high risk species, these monitoring programs provide qualitative and some quantitative information that is adequate in most cases to assess the impact of the UoAs on other species and to detect increases in risk. The main uncertainties, currently being addressed through the SESSF ERM Strategy, is the absence of information on some precautionary extreme high risk and high risk species.
PI SCORE – LOW RISK
2B: Endangered Threatened and/or Protected (ETP) Species
CRITERIA: (i) The UoA meets national and international requirements for protection of ETP species.
The UoA does not hinder recovery of ETP species.
| (a) Effects of the UoA on populations/stocks |
MEDIUM RISK |
|
At least 219 ETP species are thought to occur in the area of the CTS, including: three species of sharks, 74 species of seabirds, 51 species of marine mammals, 10 species of marine reptiles and 81 species of bony fish. (AFMA, 2015c). Protected species interactions are reported on the AFMA website: http://www.afma.gov.au/managing-our-fisheries/environment-and-sustainability/protected-species/.
For all ETP species, the risk that the fishery poses has been assessed through the application of the ecological risk assessment process described under criterion 2A(i)(a) above. Species identified through the ERA process as high risk are subject to specific risk treatment under SESSF ERM Strategy 2015 (AFMA, 2015c). These species are:
- Australian fur seal (Arctocephalus pusillus doriferus);
- Albatrosses – multiple species
A further five species are listed as ‘conservation dependent’ under the EPBC Act and therefore could be considered ‘recognised’ under national environmental legislation (MSC, 2014). These include:
- Eastern Gemfish (Rexea solandri);
- Blue Warehou (Seriolella brama);
- Orange Roughy (Hoplostethus atlanticus);
- School Shark (Galeorhinus galeus);
- Harrison’s Dogfish (Centrophorus harrisoni); and
- Southern Dogfish ( zeehaani).
Orange Roughy is assessed here as a target species and is not taken while targeting other species assessed here as target species. Accordingly, it is not considered further.
Pinnipeds (Low risk)
The areas fished by the SESSF overlap with the distributions of the Australian fur seal (Arctocephalus pusillus doriferus), New Zealand fur seal (A. forsteri) and Australian sea lion (Neophoca cinerea). Fur seal populations have recovered substantially following heavy harvesting in the 18th and 19th centuries, with conservative best estimates of current abundance of 87,424 (S.E. 10,415) published in 2016 (Mackay et al. 2016). Australian sea lions are currently listed under the EPBC Act as vulnerable and there is a formal recovery strategy in place under the EPBC Act (DSEWPC, 2013). Only the Australian fur seal was identified as high risk from the CTS sector.
There is a potential for interactions with Australian fur seals (AFSs) in the CTS wet-boat sector (wet-boats being non-freezer operations) as identified by the ERA process. Early studies suggested that more than 700 seals may be caught annually in the wet-boat sector of the CTS (Stewardson and Aust. 2007). Helidoniotis et al (2017b) report that “in 2016, 136 pinniped interactions were reported in CTS and GHTS logbooks: 18 with Antarctic fur seals, 2 with Australian sea lions, 6 with New Zealand fur seals, 71 with Australian fur seals and 39 with seals of unknown species. This is a slight increase from the 134 interactions reported in 2015. Of the 136 reported pinniped interactions, 14 of the Antarctic fur seals, 1 Australian sea lion, 5 of the 6 New Zealand fur seals, 65 of the 71 Australian fur seals and 33 of the 39 unspecified seals were reported to be dead”. Of the interactions in the CTS in 2016, 89% were in the demersal trawl sector, with the remaining interactions in the Danish seine or mid-water trawl sectors.
Mackay et al. (2016) estimated Potential Biological Removal (PBR) which is, conceptually, the maximum number of anthropogenic mortalities a marine mammal population can sustain while still allowing that “stock” to reach or maintain its optimum sustainable population. The method is sensitive to a range of recovery factors (RF) with estimates of PBR ranging from 2,623 to 4,721 for RF values of 0.5 to 0.9, respectively. In other words, the population could sustain human induced mortalities of at least 2,600 seals annually with a high degree of confidence in this measure.
Koopman et al. (2014) examined the potential for the use of shortened cod-ends to reduce interactions. They report that “interactions with a total of 44 AFSs were recorded during the 1,117 fishing operations conducted by the Western Alliance during 14 February 2013 to 17 August 2014. This information is valuable as it the single-most long-term verifiable reporting of TEP interactions of a vessel in the CTS. Of the total of 44 AFSs, 9 were recorded as released alive, while 35 were dead”. Extrapolation of these figures to total trawl effort suggests that the annual level of seal interactions would be around 500. While this rate of interaction suggests there is a discrepancy with logbooks, the level of mortality is well below the estimated PBR for the species. Therefore, the direct effects of the fishery on the species are known and are highly likely to not hinder recovery of the species.
Cetaceans (Low risk)
In 2016, one interaction with a dolphin was reported in the CTS (Helidoniotis et al, 2017b). Dolphin mortalities are a rare event and this is verified by independent observers. Accordingly, it is highly likely the fishery is not preventing the population from recovering.
Seabirds (Medium risk)
For trawl fisheries, seabirds are vulnerable to injury as a result of striking the trawl warps during fishing operations, and this occurs predominantly when offal are being discarded (e.g. Favero et al. 2011). Phillips et al. (2010) analysed observer data from the CTS in 2006 which indicated that 31 shy albatross and 9 black-browed albatross were “captured” from 856 observed trawls. One of the limitations of assessing sea bird mortalities from warp strikes is that it is difficult to determine the proportion that survive. Phillips et al. (2010) chose to include all heavy interactions with the warp wire as “captures” even if the bird initially survived the interaction, due to uncertainty in post-interaction mortality, potentially resulting in over-estimation of the mortality rate. However, it was also noted that the observer data were not collected with the explicit aim of recording seabird interactions and thus some interactions were likely to have been missed. Phillips et al. (2010) concluded that “if the numbers observed in the 2006 calendar year are typical of other years, then reducing the seabird mortality in trawl fisheries (namely the CTS) should be a priority for the development of mitigation measures.”
Phillips et al. (2010) also highlighted a discrepancy between the reporting of seabird interactions in commercial logbooks compared to the rates reported by observers. This issue remains, with Helidoniotis et al (2017b) reporting that “seabird interactions are probably under-reported for numerous reasons, including that it may be difficult to constantly observe seabirds interacting with fishing gear and vessels, and that seabirds may not have visible injury after interactions such as warp strikes.”
In 2012, a Residual Risk Assessment of the Level 2 ERA was conducted (AFMA 2012a) that included assessments for seabirds. The two species assessed by Phillips et al. (2010), shy albatross and black-browed albatross, were both assessed as medium risk. Several other albatross species were identified as high risk from the initial PSA and were reduced to medium risk in the residual risk assessment taking into account the impacts of management measures introduced for these species. The group “Albatrosses – species unidentified” was assessed as high risk after the PSA and remained high risk after the residual risk assessment. The justification for retaining the high risk was “Twelve Albatrosses (species unidentified) were caught or interacted with in 2010 and 16 in 2011; all except one animal were deceased. It has been considered that it is a TEP species and the number of interactions that have occurred and no guidelines were applied which means the risk rating remains the same.” Thus, the key outcome from the Level 2 Risk Assessment was that the group of ‘unidentified albatrosses’ were the only high risk category. It should be noted that this analysis did not include the new gear technologies that significantly reduce the probability of interaction.
Since 2010, AFMA and SETFIA have led several research projects on various approaches to mitigate the impact on seabird populations, and in the last two years several new devices have significantly and sequentially reduced the level of seabird interactions. In 2017, two new technologies (water sprayers and bird bafflers) have been legislated that are expected to result in >90% reductions in seabird interactions (and by extension mortality). Given that the only high risk species are the “unknown” group, the issue remains one of a lack of information rather than known risks to these species. In the absence of this information, at this time it cannot be argued that the fishery is highly likely to not hinder recovery of all the albatross species. However, given the low numbers of annual mortalities in the unknown category, and the recently improved gear technologies that have been and are about to be implemented, there is a plausible argument that the CTS is likely to not hinder recovery of these unknown species and thus this SI is assessed as medium risk.
Upper-slope Dogfishes (Gulper sharks) (Medium risk)
Upper-slope dogfish (or ‘gulper sharks’) were targeted in the SESSF, GABTF and NSW trawl fisheries in the 1980s and 1990s and this resulted in the stocks being substantially depleted. Targeted fishing appeared to have effectively ceased in 2002 due to declining catch rates (Wilson et al. 2009), but very small quantities are still taken as byproduct (within trip limits).
Given the depleted state of the species (estimated to be <5–10 per cent of unfished levels on the upper slope off New South Wales, and unknown in other areas) the level of fishing mortality was considered too high to enable rebuilding, and three species of upper-slope gulper sharks (Harrison’s, Southern and Endeavour dogfish) were nominated for listing under the EPBC Act in 2008. The Endeavour Dogfish was found to be ineligible for listing in 2011 however, in 2013, Harrison’s and Southern Dogfish were listed as ‘conservation dependent’ after meeting the eligibility criterion for the ‘endangered’ listing. A rebuilding strategy is a requirement of the listing.
The Upper Slope Dogfish Management Strategy 2012 forms the basis of the rebuilding strategy and is designed specifically to rebuild the populations of Harrisson’s Dogfish and Southern Dogfish above a limit reference point (BLIM) of B25 (25% of unfished biomass) (AFMA, 2012b). The recovery time to B25 is estimated at around 86 years for Harrisson’s Dogfish, and 62 years for Southern Dogfish. The Strategy relies on a new network of spatial closures supplemented by a range of operational measures including regulated handling practices, 100% monitoring, move-on provisions and no retention of gulper sharks. The new closure network will provide protection, across the depth range, of 25% of the carrying capacity weighted core habitat of the continental slope stock of Harrisson’s Dogfish, 16.2% of the east stock of Southern Dogfish and 24.3% of the central stock of Southern Dogfish, in AFMA-managed waters. This closure network also protects 25% for Harrisson’s Dogfish, 25.9% for eastern Southern Dogfish, and 20.1% for central Southern Dogfish of core habitat area. The development of the strategy was supported by an Upper-Slope Dogfish Scientific Working Group which provided expert scientific advice on specific scientific questions to inform management and recovery of upper-slope dogfish species, as well as the normal AFMA consultative structure.
Despite gulper sharks being a no-take multispecies stock under the Strategy, reported landings for the trawl fishery were 0.3 t in the 2016–17 season (Helidoniotis et al, 2017a). Helidoniotis et al (2017a) suggest that this may reflect reporting errors. Nevertheless, they also note that “there is potential for unreported or underestimated discards, based on the large degree of overlap of current fishing effort with the core range of the species. Low levels of mortality can pose a risk for such depleted populations”.
The analysis undertaken during the development of the strategy provides some objective basis that the measures will work, although it is not clear at this point that the measures are being implemented successfully (there is no evidence yet of recovery) and there remains uncertainty over whether overfishing is occurring (Helidoniotis et al, 2017a). Accordingly, this SI is scored medium risk.
School shark (Medium risk)
While the school shark stock is overfished, catch from the otter trawl fishery is not likely to hinder recovery of the species. School shark catch from the otter trawl sub-fishery was 16 t on average for the last 3 years. This is less than 10% of the total catch of the species in the south east. Mortality from the UoA is considered within the Rebuilding Strategy, and current total commercial fishing mortality is within the limits set by the revised Strategy (AFMA 2014c).
Syngnathids (Low risk)
Syngnathids are taken as bycatch in the CTS in otter-trawl and Danish-seine nets but they are generally small and difficult to observe among large catches of fish. The ERAEF noted that 61 syngnathids have the potential to interact with the fishery and of these, only one was classified as high risk. However, when these risks were elevated to the Level 3 SAFE assessment conducted by Zhou et al. (2012), there were no syngnathids identified as high risk. On the basis of this outcome, it is expected that impacts on syngnathids are known and direct effects of the fishery are highly unlikely to hinder recovery.
Blue Warehou (Medium risk)
Blue Warehou has been classified as overfished since 1999 (Helidoniotis et al, 2017a). In February 2015, the species was listed as conservation dependent under the EPBC Act 1999. Two stocks of Blue Warehou exist: eastern and western. The stocks are managed under the SESSF tier 4 HSF and assessed using standardised CPUE to determine RBCs.
The 2008 rebuilding strategy for Blue Warehou was revised in 2014 (2014d) with the aim to prevent targeted fishing for Blue Warehou, minimise incidental catches and improve knowledge of stock status. The objective of the strategy is to rebuild the stock to its limit reference point (B20) by no later than 2024, and from there ultimately to the BMEY-based target reference point of B48. The strategy sets the targeted TAC at zero and allows for a limited bycatch TAC to cover incidental catches. The incidental TAC is currently set at 118t, consistent with CSIRO analysis of ‘unavoidable’ catch in 2010 (ShelfRAG, 2015). In the context of this SI, the incidental catch limit could be considered a ‘national limit’. The landed catch for 2016–17 was 16 t, and the weighted average discards were 8.68 t. The catch and discards combined was 24.68 t.
ShelfRAG (2015) examined progress towards achieving the objectives of the rebuilding strategy in 2015. They noted that catches have been small and over the last few years and below the incidental TAC, although as a consequence of low catches there are little data with which to assess recovery. They also noted that the number of shots containing more than 250 kg of Blue Warehou had declined over the previous 10 years with the most recent year being the lowest on record, catches of Blue Warehou by the top 10 boats had declined from 116 tonnes to less than two tonnes, and there was some evidence of range contraction.
Using projections from the Tier 1 stock assessment for the western stock, Haddon (2015; in ShelfRAG, 2015) projected that under recent catch conditions and using the highest average observed recruitment the stock should have rebuilt to 80% of the its original biomass; under average recruitment observed between 1987 and 2005 the stock should be at B38; and under the lowest average recruitment the stock should be at B20. On that basis, he concluded that the failure of the stock to recover seems unlikely to be due to excessive current incidental catches. A change in recruitment success could offer an explanation for the lack of observed rebuilding, as could a change in reproductive productivity although there is no mechanism to evaluate if this is the case (ShelfRAG, 2015).
Based on the available evidence, ShelfRAG (2015) concluded that current catches, even with low recruitment, should not be impeding recovery and catches would have to be substantially underestimated to have any effect.
Although level of fishing mortality that will allow the stock to rebuild is uncertain, recent catches in the CTS are estimated to have been substantially below the incidental catch limit, modelling suggests the failure of the stock to recover is unlikely to be due to excessive incidental catches and the relevant RAG has concluded that current catches should not be impeding recovery. On that basis, there is a plausible argument that the known direct effects of the CTS are unlikely to be hindering recovery consistent with the medium risk SG. Nevertheless, the fishery would be better placed against this SI with some evidence of actual recovery.
Eastern Gemfish (Precautionary high risk)
Note: Because it is both a target species and an ETP species, Eastern Gemfish is assessed in Component 1 and here in Component 2 (i.e. Eastern Gemfish would be considered an ETP species for UoAs in which Eastern Gemfish is taken incidentally while targeting other species).
Eastern Gemfish is currently assessed as overfished. The integrated stock assessment model for Eastern Gemfish was last updated in 2010 with data on catch and length frequency up to 2009 (Little & Rowling 2010). The 2010 estimate of spawning stock biomass in 2009 was 15.6 per cent of the 1968 level.
The 2010 assessment included projections of Eastern Gemfish biomass based on average historical recruitment that examined two catch scenarios: total catches of 100 t each year and zero catches each year. The projection for zero catch indicated that the point estimate of biomass might reach 0.2SB before 2020. Projections for annual catches of 100 t suggested recovery to 0.2SB by 2025 (Morison et al, 2012). A full assessment has not been completed since 2010 due to a paucity of useful additional datasets. Nevertheless, an assessment of spawning potential ratio (SPR) was conducted to examine whether current levels of fishing represented overfishing of the stock (Little, 2011; in AFMA, 2015a). The SPR analysis showed that the ratio was high until the late 1970s when there were high recruitments and spawning biomass; SPR decreased starting in the mid-late 1970s reaching the lowest point in 1988 corresponding to high catches and thereafter has increased to earlier levels.
A stock recovery plan is in place with an incidental TAC of 100 t that aims to prevent targeting and promote recovery of the stock to a level above the limit reference point by 2027 (AFMA, 2015a). In the context of this SI, the 100t incidental TAC could be considered to be a national limit.
Although discards were high in 2013, and meant total fishing mortality (retained catch plus discards) was around double the incidental TAC, SERAG (2016) reports that total fishing mortality in Commonwealth fisheries was below the incidental TAC in 2012, 2014 and 2015. Moreover, Helidoniotis et al (2017a) report that the total fishing mortality in the 2016-17 fishing year was below the incidental TAC (77.4t in total).
While total mortality from the CTS has been below the incidental catch limit in most of the past five years, the main uncertainty is the extent to which existing catches may be hindering recovery under the low recruitment conditions experienced over recent years. Morison et al (2012) noted that stock recovery projections predicting the stock would recover to BLIM by 2025 depend strongly on average recruitment (also acknowledged in the rebuilding plan; AFMA, 2015a). However, Little and Rowling (2010) estimated that most of the recruitments during the last 25 years have been relatively weak. On that basis, while current catches in the CTS could be expected to not hinder recovery under average recruitment conditions, the extent to which they may hinder recovery under low recruitment conditions is unclear. Accordingly, we have scored this SI precautionary high risk.
Other listed species
Sharks (Low risk)
A number of other shark species are listed on international conventions to which Australia is a member and are therefore recognised under the EPBC Act. These include Longfin Mako (Isurus paucus), Shortfin Mako (Isurus oxyrinchus) and Porbeagle (Lamna nasus) sharks – listed on the EPBC Act in January 2010 after their inclusion on Appendix ii of the Convention of Migratory Species (CMS) – and Scalloped Hammerhead Shark (Sphyrna lewini), Great Hammerhead Shark (Sphyrna mokarran), Smooth Hammerhead Shark (Sphyrna zygaena) and Oceanic Whitetip Shark (Carcharhinus longimanus), included on Appendix II of the Convention on International Trade in Endangered Species of Wild Fauna and Flora (CITES) in September 2014. Porbeagle sharks were also included on CITES Appendix II at the same time.
Catches of each of these species is small or non-existent in the CTS. An average of 1.9t of retained catch of Shortfin Mako was reported during 2013 to 2015. Relative to catches in other fisheries (Clarke, 2011, notes that median estimates by number of mako sharks recorded by observers in South Pacific longline fisheries were between 50,000-250,000 individuals in 2006), it is highly unlikely that the marginal impact of catches in the CTS are hindering recovery. Of the remaining species, an average of 68kg of Smooth Hammerhead Shark was retained between 2013 and 2015, 32kg of Porbeagle was retained in 2014 and no retained catches of the other species were reported.
Scoring
Of the ETP species assessed above, the eastern stock of Gemfish received the highest risk rating of precautionary high risk. Target species UoAs likely to interact with this stock are therefore scored precautionary high risk and include: Blue Grenadier, Blue-eye Trevalla, the Pink Ling – eastern stock, Gould’s Squid and Ocean Jacket. The remaining stocks are scored medium risk.
CRITERIA: (ii) The UoA has in place precautionary management strategies designed to:
- meet national and international requirements; and
- ensure the UoA does not hinder recovery of ETP species.
| (a) Management strategy in place |
LOW RISK |
|
AFMA has a comprehensive framework of measures in place to manage the impacts of the fishery on ETP species.
The SESSF Management Plan 2003 sets out clear objectives for the management all species impacted by the fishery (i.e. that the fishery is “conducted in a manner consistent with the principles of ecologically sustainable development and the exercise of the precautionary principle and, in particular, the need to have regard to the impact of fishing activities on non-target species and the long-term sustainability of the marine environment”), as well as actions by which the objectives will be achieved. In relation to non-target species these include:
- Monitoring through a structured program, the impact of fishing on fish species, any other species that are caught as by-catch, ecologically-related species and the marine environment, analysing the impacts and implementing any strategies necessary to ensure: (i) the sustainability of those species and the marine environment; and (ii) that by-catch limitations are not exceeded;
- periodically checking the accuracy and consistency of information kept in relation to the fishery
The impacts of the fishery on all ETP species in the fishery area have been assessed through the ERA framework described in 2A(i). For those species identified as high risk, measures to mitigate risks are set out in the SESSF ERM Strategy (AFMA, 2015c). Key measures in place which serve to mitigate risks include:
- Limited entry;
- Catch controls (e.g. zero targeted TACs and incidental catch trip limits);
- Gear modifications such seal excluder devices (SEDs) and bird scaring devices;
- Extensive spatial closures under fisheries legislation (e.g. deepwater shark closures);
- Extensive spatial closures to trawling under the South East Marine Protected Area network (388,464 km2 with a depth range of 40m – 4600m).
All interactions with ETP species are required to be reported in compulsory logbooks. Interactions are also reported by observers under the ISMP.
- In addition to the measures above, a framework of species
-specific conservation measures apply. These include:
‘Conservation dependent’ species
Fishing restrictions have been imposed on all overfished stocks listed under the EPBC Act as ‘conservation dependent’. These restrictions are to promote the rebuilding of the stock to a level above the target reference limit within an allocated timeframe. AFMA develops stock rebuilding strategies in consultation with the fishing industry, the Department of the Environment, the Department of Agriculture and the relevant management advisory committee and resource assessment group.
Rebuilding strategies are reviewed every five years to monitor the progress of rebuilding and ensure the continued effectiveness of management arrangements which have been implemented.
Specific management plans have been compiled for the following ETP species[1]:
- School shark Rebuilding Strategy 2015
- Orange Roughy Rebuilding Strategy 2014
- Upper Slope Dogfish Strategy 2012
- Eastern Gemfish Rebuilding Strategy 2015
- Blue Warehou Rebuilding Strategy 2014
These instruments are likely to be considered a strategy that is expected to ensure the UoA does not hinder recovery. The main uncertainty for several species is the extent to which measurable recovery has occurred (e.g. Eastern Gemfish, Blue Warehou), and the extent to which recovery will occur under recent recruitment conditions.
Pinnipeds
SEDs have been compulsory for freezer boats in this component of the SESSF since 2005, and modifications to fishing practices seem to have substantially reduced the incidence of seal bycatch in the midwater nets of factory vessels (Helidoniotis et al, 2017b). Trials of SEDs in the wet-boat sector have achieved positive results (Knuckey, 2009), and industry has adopted a code of conduct that includes voluntary measures to minimize interactions. Seal bycatch (alive or dead) must be formally reported to SEWPaC and AFMA within 24 hours of the time of capture. Helidoniotis et al (2017b) report that “trials of a flexible SED design suitable for use in smaller nets have been reasonably successful (Knuckey, 2009), but reliably estimating and reducing the level of interactions between seals and wet-boats remain difficult. A trial using a shortened codend to reduce seal bycatch was completed in late 2014. The trial found no definitive proof that short trawl nets had lower interaction rates with seals, caught fewer seals or resulted in lower mortality rates of caught seals (Koopman et al. 2014).” Historically, there have been concerns about under-reporting of pinniped interactions.
The framework of measures in place through the SESSF Management Plan, ERA/ERM processes, independent monitoring through observers, targeted research and species specific measures to limit interactions (e.g. SEDs) are likely to be considered a strategy that is expected to ensure the UoA does not hinder recovery for high risk pinnipeds.
Seabirds
In response to the detection of seabird interactions with trawl gear in the SET and GAB sectors of the SESSF, AFMA has worked in conjunction with industry and seabird experts to develop and implement Seabird Management Plans (SMPs) on all SESSF otter board trawl vessels (Helidoniotis et al, 2017b). Seabird management plans were introduced in the CTS in 2011.
Seabird management plans are tailored to individual fishing boats and identify the main threats posed to seabirds by that boat. Each plan identifies the physical mitigation measures to stop seabirds from interacting with the warp wires and other fishing gear. They also include measures dealing with the discharge of biological waste from vessels to reduce seabird attraction and interaction. Further ‘common-sense’ measures are employed by fishers to help reduce the risk of interactions, including reducing the time the nets are on the surface of the water and cleaning the net of fish when re-setting. This reduces the likelihood of seabirds using the nets as a food source and consequently getting entangled. Seabird Management Plans set out a variety of proven mitigation measures that are tailored to each vessel in each fishery. Trawl fishers must use ‘warp deflectors’ or pinkie devices. These are pink buoys that sit alongside the trawl gear as a visual deterrent. The buoys also act as a physical barrier between birds and fishing gear.
Recently, the South East Trawl Fishing Industry Association (SETFIA) led a research project to trial other alternative seabird mitigation devices, which resulted in sea trials for two new devices: water sprayers and bird bafflers (Boag, 2016). Sprayers were found to reduce interactions by 92% while bafflers reduced interactions by 96%. AFMA have approved both approaches for use as seabird mitigation devices within vessels’ seabird management plan (as a condition on the fishing permit). From 1 May 2017, all CTS trawl vessels must use one of these two devices or continue with pinkies and not discharge offal while towing. As it is not economical to retain offal, it is probably reasonable to assume that from May 2017, uptake of the new devices is likely to be high. SETFIA have also recently introduced a Code of Conduct and an E-Learning programme to attempt to improve seabird avoidance measures and seabird interaction reporting.
CTS vessels are also subject to the measures in the National Recovery Plan for Threatened Albatrosses and Giant Petrels 2011-2016 (DSEWPC, 2011).
The framework of measures in place through the SESSF Management Plan, ERA/ERM processes, independent monitoring through observers, targeted research and species specific measures to limit interactions (e.g. seabird mitigation devices) are likely to be considered a strategy that is expected to ensure the UoA does not hinder recovery for seabirds.
[1] http://www.afma.gov.au/sustainability-environment/protected-species-management-strategies/
| (b) Management strategy implementation |
MEDIUM RISK |
There is an objective basis for confidence for some species groups (e.g. mitigation approaches for seals and seabirds have followed international best practice approaches) that the management measures are likely to work, however in the case of Eastern Gemfish, Blue Warehou and Upper Slope Dogfish there is currently insufficient evidence to suggest that the strategy is being implemented successfully. As such this SI is assessed as medium risk on the basis that a plausible argument exists that the measures are likely to work.
CRITERIA: (iii) Relevant information is collected to support the management of UoA impacts on ETP species, including:
- information for the development of the management strategy;
- information to assess the effectiveness of the
- management strategy; and
- information to determine the outcome status of ETP species.
| (a) Information |
MEDIUM RISK |
|
There is substantial quantitative information on all ETP interactions to ensure an adequate assessment of fishery-related mortality and to support the strategy to manage impacts on ETP species. All ETP species identified through the ERA process (as occurring in the area of the fishery) have been included in the priority list for each fishery within the Ecological Risk Management (ERM) reports. Many of the identified species are also managed under various national plans of action.There is an objective basis for confidence for some species groups (e.g. mitigation approaches for seals and seabirds have followed international best practice approaches) that the management measures are likely to work, however in the case of Eastern Gemfish, Blue Warehou and Upper Slope Dogfish there is currently insufficient evidence to suggest that the strategy is being implemented successfully. As such this SI is assessed as medium risk on the basis that a plausible argument exists that the measures are likely to work.
Those applicable to the Otter Trawl sub-fishery include the:
- National Strategy to Address Interactions between Humans and Seals: Fisheries Aquaculture and Tourism;
- Recovery Plan for Marine Turtles in Australia; and
- Australian Sea Lion Management Strategy.
Operators are also required to report all interactions with ETP species in daily logbooks, and to carry an independent observer upon request by AFMA. In 2016-17, the coverage target was 129 sea days, allocated across different geographical regions and times of the year (Helidoniotis et al, 2017a). Although the ISMP was not developed to evaluate ETP species interaction, ISMP data has been used to validate logbook data. In regard to ETP species, SESSF fishers are required to recorded wildlife interactions on shot by shot scientific logbooks. The following information is collected on protected species:
- Gear details, location, depth and time of interaction;
- Details of the species encountered –estimated length, weight, adult/juvenile and gender;
- Type of interaction (e.g., sighting, death, injury, entanglement, hooked, caught during haul/set/other). If and how, the animal interacted with the catch (e.g., ate fish, took bait), where the animal was hooked or entangled (e.g., flipper, swallowed hook) and which part of the gear the animal encountered (e.g., buoy line, branch line).
A summary of interactions with commonwealth fisheries is available online at:
http://www.afma.gov.au/environment/eco_based/reporting.htm#reports.
Retained species assessed here as ETP have stock assessments undertaken on a regular basis. These estimates of stock status provide a meaningful measure of where the biomass is relative to accepted reference points, and also provide a means to tracking stock recovery.
Fishing operators are able to use AFMA approved electronic monitoring equipment to meet the 100 per cent observer requirements when fishing the Australian Sea Lion Management Zone and Dolphin Observation Zone off South Australia. As 100 per cent monitoring coverage is a condition of fishing in these zones, operators must keep their electronic monitoring equipment operating at all times when fishing in, or transiting through these zones.
To assist fishers accurately identify protected species, AFMA has produced a protected species identification guide and a seabird identification guide.
Accordingly, there is quantitative information available which is adequate to assess the UoA related mortality and to support strategies to manage impacts.
PI SCORE – MEDIUM RISK
2C: Habitats
CRITERIA: (i) The UoA does not cause serious or irreversible harm to habitat structure and function, considered on the basis of the area(s) covered by the governance body(s) responsible for fisheries management
| (a) Habitat status |
LOW RISK |
|
Demersal otter-trawl gear is considered a potentially highly damaging gear-type, and the detrimental effect on habitat structure that comes into contact with trawl gear is well documented (e.g. Poiner et al, 1999; Kaiser et al. 2006; Althaus et al. 2009; Clark et al. 2012).
Recent modelling of the spatial extent of effort in the CTS suggests the fishery has a relatively small footprint across the South East Marine Region shelf and slope areas. Pitcher et al (2015) modelled the effects of fishing for 15 spatially unique species assemblages and 10 habitat forming benthos taxa types that had been predicted and mapped from survey data. They reported that:
- Simulation of the bottom trawl fishery from ~1985, when consistent logbook records were available, showed that all 10 benthos taxa types declined in abundance in trawled areas until the mid-2000s. At this time fishing effort decreased due to economic pressures and licence buybacks, and large areas were closed to trawling. A complex picture emerged, with patterns and responses varying spatially according to the distribution of benthos taxa types, trawling distribution, and type of management action;
- The lowest total regional abundance (status) of habitat-forming benthos taxa types across the SEMR was ~80–93% of pre-trawl status, after effort peaked during 2000–2005. Subsequently, all taxa were predicted to recover by varying extents (~1–3%) in the following decade. Had none of the management actions been implemented, benthos status was predicted to stabilise or recover slowly, and with all management actions in place, the rate and magnitude of recovery was greater. Reductions in trawl effort universally improved the status of habitat-forming benthos, with the larger 2006 licence buy-back leading to greater improvements than the 1997 buy-back;
- In some cases, spatial management that excluded trawling, particularly deepwater fishery closures, led to improved status of some benthos taxa types. Most fishery closures and Commonwealth Marine Reserves (CMRs) had little detectable influence on status. However, there were cases where closures worsened the status of some taxa in some locations, because displaced trawling moved to areas where such taxa were more abundant.
Overall, they reported that around 6% of the shelf and slope area was exposed to trawl effort annually, with around 23% of the SEMR region exposed across the life of the study (Table 5). Of the habitat forming tax types, the maximum level of exposure was 9%.
Table 5: Inclusion of benthic biodiversity in Commonwealth Marine Reserves and fishery closures, and exposure to human uses (Pitcher et al, 2015)
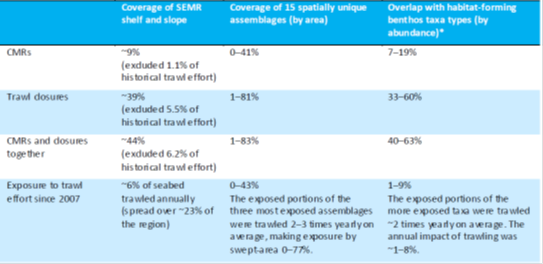
Based on this it appears highly unlikely that the UoA will reduce habitat structure and function to the point of serious or irreversible harm. We also note that the MSC assessment for the Blue Grenadier sub-fishery of the CTS (SCS 2013) assessed habitat status as a score of SG80, but it must be noted that this fishery is predominately mid-water trawl with only a small component of benthic otter trawl. In summarising the available habitat information SCS (2013) stated: “There is good understanding of the main habitat types in the area of the fishery and information is available to broadly understand the main impacts of the gear. However, there is limited new information available on the marine habitat structure on a scale relevant to the fishery. Demersal trawl fishing is generally not expected to cause serious or irreversible harm to any habitats although concerns remain about the impacts on the upper slope areas (200 to 700m deep) where much of the fishing is concentrated. Current closed areas are comprehensive, adequate and representative such that serious or irreversible harm is not expected on a broad regional scale.”
CRITERIA: (ii) There is a strategy in place that is designed to ensure the UoA does not pose a risk of serious or irreversible harm to the habitats.
| (a) Management strategy in place |
LOW RISK |
|
The measures in place to manage impacts of trawling on habitats in the CTS area include:
- Spatial closures through fisheries and Commonwealth marine parks legislation;
- Indirect limits on fishing effort through target species TACs;
- Monitoring of the location and intensity of fishing effort through logbooks and VMS;
- Assessment and treatment of priority risks through the ERA and ERM process.
Spatial closures
Approximately 86 per cent of trawl grounds have been closed within the CTS, including large areas of Bass Strait and coastal areas in South Australia (Figure 5). Trawling that does occur tends to be over grounds that have been trawled historically, i.e. the trawling footprint is not expanding (AFMA, 2015c). Closures have been introduced for a range of reasons including the protection of depleted species (Table 6 and Table 7), however all will serve to limit the direct impact of trawling on benthic habitats.
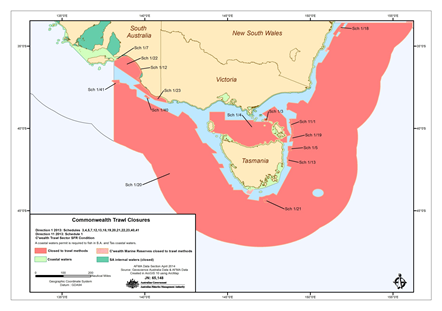
Figure 6: Spatial closures within the Commonwealth Trawl Sector area (AFMA, 2015e)
Table 6: Closures relevant to the CTS under the Upper Slope Dogfish Management Strategy (AFMA, 2015c)
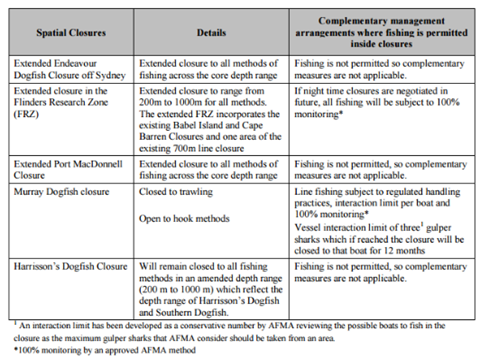
Table 7: Spatial closures which have implemented to protect ETP and high risk species in the CTS (AFMA, 2015c)
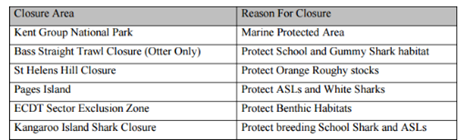
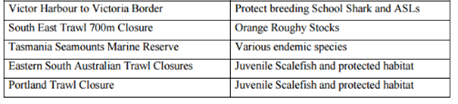
In addition to closures under fisheries legislation, in 2007 a network of 14 marine protected areas was declared in the South-east marine region (Figure 6). The South-east Commonwealth Marine Reserves Network stretches from the south coast of New South Wales, around Tasmania and Victoria and west to Kangaroo Island off the South Australian Coast. The reserves cover an area of 388,464 km2 with a depth range of 40m – 4600m. The reserves include a range of ecosystems, habitats and biological communities. The zoning within the South-east network does not permit otter trawling. The magnitude and placement of the marine park network does provide some permanent protection to representative samples of marine habitats within the area of the fishery.
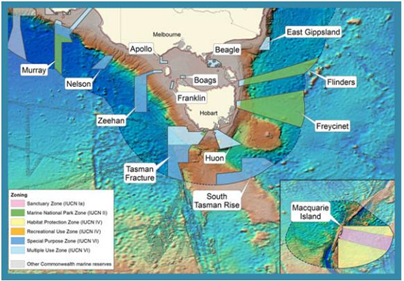
Figure 7: Commonwealth south east region marine reserve network[1].
[1] http://www.environment.gov.au/topics/marine/marine-reserves/south-east
ERAs/ERM
AFMA has undertaken detailed ecological risk assessments (ERAs) for all major Commonwealth managed fisheries as a key part of the implementation of the ecosystem based fisheries management. ERAs assess the risks that fishing poses to the ecological sustainability of the marine environment by considering the impact of fishing on all components of the marine environment, including risks to habitats. The main purpose of ERAs is to prioritise the management, research, data collection and monitoring needs for each fishery.
The fishery has been subjected to Level 1 and Level 2 risk assessments for habitats (Wayte et al. 2007). Hobday et al. (2011) provide a framework to move habitat assessment toward Level 3 assessments, including a Level 2 residual risk assessment, which will move the process from the ERA to the Ecological Risk Management (ERM) framework.
Together, these measures and the ongoing ERA process are likely to be considered at least a partial strategy to ensure the UoAs do not cause serious and irreversible harm to habitats.
| (b) Management strategy implementation |
LOW RISK |
|
The work of Pitcher et al (2015) provides some objective basis that the strategy will work, and some quantitative evidence that the strategy is being implemented successfully.
CRITERIA: (iii) Information is adequate to determine the risk posed to the habitat by the UoA and the effectiveness of the strategy to manage impacts on the habitat.
| (a) Information quality |
LOW RISK |
|
There are considerable data on the nature, distribution and vulnerability of the main habitats of the CTS. Habitat information in the SESSF has been collected by Bax & Williams (2001) and Williams et al. (2006), the latter report integrating fisher knowledge with scientific data to provide an assessment of 516 “fishing grounds”. The ERA process (Wayte et al. 2007) identified and ranked risks to 156 separate habitats in the fished area. Spatial closures include the Commonwealth Marine Reserve Network and fishery-specific spatial closures. All trawl tracks are recorded by VMS. More recently, Pitcher et al (2015) examined the spatial extent of the fishery in relation to unique assemblages and habitat forming taxa. These data are relevant to the scale and intensity of the fishery and as such this criterion is assessed as low risk.
| (a) Information and monitoring adequacy |
LOW RISK |
|
Information is broadly adequate to understand the main impacts of gear on the main habitats and this has been assessed through the ERA process (Wayte et al, 2007). There is also reliable information on the spatial extent of interaction through VMS records. Pitcher et al’s (2015) analysis provides information on the spatial overlap of trawl effort with vulnerable habitat types. As a result, we have scored this SI low risk.
PI SCORE – LOW RISK
2D: Ecosystems
CRITERIA: (i) The UoA does not cause serious or irreversible harm to the key elements of ecosystem structure and function.
| (a) Ecosystem Status |
LOW RISK |
|
Serious or irreversible harm in the ecosystem context should be interpreted in relation to the capacity of the ecosystem to deliver ecosystem services (MSC, 2014). Examples include trophic cascades, severely truncated size composition of the ecological community, gross changes in species diversity of the ecological community, or changes in genetic diversity of species caused by selective fishing.
The risks that the SESSF poses to the sustainability of the marine ecosystems in which it operates have been investigated through the AFMA ERA process involving:
- Level 1 analysis (SICA – Scale Intensity Consequence Analysis)
- Level 2 analysis (PSA – Productivity Susceptibility Analysis)
- Level 2 analysis (Residual risk PSA)
- Level 3 analysis (SAFE – Sustainability Assessment for Fishing Effects)
In the case of the SESSF, residual risk assessment guidelines have also been applied to the outcomes of the Level 3 SAFE assessment.
The ERAEF is employed for all elements of the fishery including species (target, byproduct, discard and ETP), habitats and ecosystems. Wayte et al. (2007) assessed the following number of ecological units for the CTS fishery: 28 target, 95 by-product, 276 discard, 201 ETP, 158 habitat and 33 community.
For the CTS, 600 species in total were assessed at the Level 2 (Productivity and Susceptibility Analysis; PSA) stage. Of these 600, 159 species were classified as high risk; the majority of the high-risk species were chondrichthyans or teleosts. The Level 3 SAFE reduced the number of high-risk species to 23. During the residual risk process, new information was identified that allowed the total number of high-risk species to be reduced to 10. These species include several low-productivity, deepwater sharks, several seabirds and the Australian fur seal. The SAFE assessment was re-evaluated in 2012 (Zhou et al. 2012) and additional species were included as high risk for further examination. Residual risk assessment guidelines were applied to the outcomes of the updated SAFE assessment in 2014 to arrive at a final list of 11 species deemed to be at either high or precautionary high risk which require treatment in the SESSF ERM Strategy 2015. These processes provide some confidence that the fishery is not causing serious or irreversible harm to these elements of the ecosystem.
The original ERA (Wayte et al. 2007) did not address community units at the Level 2 PSA. Hobday et al. (2011) aimed to “complete the development of the ERAEF Level communities (ecosystems) approach”. The key outcomes from this FRDC project with regard to ecosystem status were described by following excerpt from Hobday et al. (2011): “a set of attributes that represent the productivity and susceptibility of an ecological community were determined and a scoring system for these attributes devised. The methods were then tested on the CTS. A set of 27 benthic communities were identified, and each one scored using the five productivity attributes and seven susceptibility attributes for potential risk as a result of the CTS. A total of six communities were identified as potential high risk, including two off Western Tasmania, and one off south-east Victoria. Overall, the results for the SESSF case study showed that the communities that might be intuitively considered to be at higher risk due to known fishing patterns, such as the South Eastern 110-250m (general concentration of effort) and the Western Tasmanian Transition 250-565m (targeting of certain species such as spotted trevalla [warehou]), were also ranked as high risk in the community PSA. Targeting of Blue Grenadier and Orange Roughy (and high reported catches) in the deeper Tasmanian communities resulted in only medium risk to the communities in this assessment. Communities where fishery effort was relatively low were generally ranked as low to medium risk.” The assessment of risks from fishing at the community level have not passed beyond these published results.
An ecosystem model termed “Atlantis” has also been developed for the fishery (Fulton et al. 2007). While the model has been used for MSE evaluations, its capacity to deliver outputs that help to define the status of the ecosystems in South-East Australia is limited (Fulton et al. 2007).
Although neither the ecosystem model nor the ERAEF process provide direct evidence that the fishery is not affecting the ecosystem, there is sufficient knowledge of the key elements of the ecosystem that when considered in combination with the management measures in place (significant spatial closures, limited spatial footprint, reductions of 60% in trawl effort, and gear limitations including legislated bycatch exclusion devices) and the largely positive stock status of the main target species, provide sufficient confidence that the CTS is highly unlikely to disrupt the key elements underlying ecosystem structure and function to a point where there would be a serious or irreversible harm.
CRITERIA: (ii) There are measures in place to ensure the UoA does not pose a risk of serious or irreversible harm to ecosystem structure and function.
| (a) Management strategy in place |
LOW RISK |
|
The fishery has in place measures that can be considered at least a partial strategy to ensure that the fishery does not impact on the ecosystem to cause serious and irreversible harm. The strategy is underpinned by harvest strategies which aim to maintain targeted stocks at levels higher than that consistent with MSY and the ERA framework which assesses all the key elements of the ecosystem as described previously. Key impacts on species have been assessed to the Level 3 stage, with outcomes documented through the various risk assessment reports culminating in the SESSF ERM Strategy (AFMA, 2015c). Hobday et al. (2011) documented the first Level 2 community assessment for a Commonwealth fishery using the CTS as a case study
To address risks identified through the ERA process, AFMA and industry have developed various implementation strategies including:
- Harvest strategy to limit catches of target stocks (and hence total effort);
- Recovery strategies for overfished stocks;
- Bycatch Action Plans (target stock and bycatch);
- Gear modification requirements (to mitigate capture of juvenile target species and bycatch);
- Use of seal exclusion devices on mid-water trawl nets;
- Introduction of spatial closures (including Marine Protected Areas);
- Research and modelling into the trophic ecology of south-eastern Australia.
- Ongoing monitoring (observer coverage and logbook assessment);
| (b) Management strategy implementation |
LOW RISK |
|
The extensive assessment and treatment of ecological impacts through the ERA/ERM process, stock assessment and modelling results for the main target species, which form the bulk of the overall catch and are largely in positive positions against reference points, successful measures to recover overfished species (e.g. Orange Roughy eastern zone) and minimize impacts of ETP species (e.g. SEDs; seabird mitigation devices), together with habitat modelling showing the fishery is likely to cover ~6% of the slope and shelf area of the SEMR annually provide some objective basis for confidence that the partial strategy will work and some quantitative evidence that the measures are being implemented successfully.
CRITERIA: (iii) There is adequate knowledge of the impacts of the UoA on the ecosystem.
| (a) Information quality |
LOW RISK |
|
There has been significant investment in research for the fishery in all elements of the ecosystem, including species (target, byproduct, ETP), habitats and ecosystems. While these information sources vary in detail and progression of knowledge, they have been collected in a manner that provides a sound understanding of these key ecosystem elements and allows for detection of changes in risk.
Critical data sources include but are not limited to: catch and effort logbooks, VMS data, observer data, fishery-independent survey data, and habitat mapping data.
| (b) Investigations of UoA impacts |
LOW RISK |
|
The main impacts of the UoA on the ecosystem are well understood and most of them have been studied in significant detail. Target species are assessed and quotas determined on an annual basis. Impacts on bycatch species have been evaluated through the ERA process utilising data from various studies that provide fishery-dependent and fishery-independent data sources (e.g. Zhou et al 2012). ETP species have been studied extensively through the ERA process and species specific research programs (e.g. Mackay et al, 2016. Habitats have been examined thoroughly through several studies (e.g. Bax & Williams 2001, Williams et al. 2006, Wayte et al. 2007; Pitcher et al, 2015). Ecosystem impacts have been examined through the Atlantis model, albeit that the interpretation of results was limited to Management Strategy Evaluations (Fulton et al 2007). This is sufficient to assess this criterion as low risk.
PI SCORE – LOW RISK
COMPONENT 3: Management system
3A: Governance and Policy
CRITERIA: (i) The management system exists within an appropriate and effective legal and/or customary framework which ensures that it:
- Is capable of delivering sustainability in the UoA(s)
- Observes the legal rights created explicitly or established by custom of people dependent on fishing for food or livelihood.
| (a) Compatibility of laws or standards with effective management |
LOW RISK |
|
Relevant Australian Commonwealth Acts, subsidiary legislation and cooperative instruments, including the EPBC Act 1999, Fisheries Management Act (FMA), Fisheries Administration Act (FAA) provide an effective legal framework for the purposes of delivering management outcomes consistent with Components 1 and 2. The FMA takes account of the United Nations Fish Stocks Agreement and FAO’s Code of Conduct for Responsible Fisheries.
| (b) Respect for Rights |
LOW RISK |
|
The management system has a mechanism to formally commit to the legal rights created explicitly or established by custom on people dependent on fishing for food and livelihood. The Commonwealth Native Title Act 1993 formally commits to the rights of indigenous people who can demonstrate their customary rights to fish in a particular area. This legislation provides a mechanism for the making of binding decisions about native title rights to areas of land and water and thereby ensures access to fish resources for people who depend on fishing for their food. AFMA’s jurisdiction typically begins three nautical miles offshore, thus, there is usually no overlap between Commonwealth commercial fishing and customary fishing activity. However, for some fisheries, consideration of customary fishing is largely made through interaction between AFMA’s management and the Native Title Act 1993. Where AFMA modifies an act, a direction or other legislative instrument in a way that may affect native title, that change triggers the ‘future act’ provision of the Native Title Act 1993. In situations where a future act provision could possibly be triggered, AFMA provides the opportunity for relevant native title bodies to be consulted and provide comment. In addition, Fisheries Legislation Amendment (Representation) Bill 2017 is currently before the Commonwealth parliament. The Bill provides for explicit recognition of recreational and Indigenous fishers in Commonwealth legislation and requires AFMA to have regard to ensuring that the interests of all fisheries users are taken into account in Commonwealth fisheries management decisions[1].
Given the above, the management system has a mechanism to observe the legal rights created explicitly or established by custom of people dependent on fishing for food or livelihood.
[1] http://www.aph.gov.au/Parliamentary_Business/Bills_Legislation/bd/bd1617a/17bd090
CRITERIA: (ii) The management system has effective consultation processes that are open to interested and affected parties. The roles and responsibilities of organisations and individuals who are involved in the management process are clear and understood by all relevant parties.
| (a) Roles and Responsibilities |
LOW RISK |
|
The roles and responsibilities of the main people (e.g. Fisheries Minister, AFMA Commissioners) and organisations (AFMA) involved in the Australian Commonwealth fisheries management process are well-understood, with relationships and key powers explicitly defined in legislation (e.g. FMA, FAA) or relevant policy statements (e.g. AFMA Fisheries Management Paper 1 – Management Advisory Committees). There is a Management Advisory Committee (SEMAC) and Resource Assessment Group (SERAG) providing advice on the management of the fishery.
| (b) Consultation Process |
LOW RISK |
|
The management system includes consultation processes that regularly seek and accept relevant information, including local knowledge. The management system demonstrates consideration of the information and explains how it is used or not used.
Resource Assessment Groups (RAGs) are the bodies responsible for providing scientific advice to the Management Advisory Committees (MACs) and the AFMA Commission on the status of fish stocks, sub-stocks, species (target and non-target), and the impact of fishing on the marine environment. They coordinate, evaluate and regularly undertake fishery assessments, and provide recommendations on issues such as the setting of total allowable catches, stock rebuilding targets, and biological reference points. Membership of the RAGs comprises representatives from the areas of fisheries management, research, industry, fisheries economics and conservation. The broad membership ensures that, in addition to scientific information on each fish stock, industry knowledge and developments in management strategies, market prices and the costs of harvesting are also taken into account.
MACs are the main advisory bodies to AFMA. They provide advice on a variety of issues including fisheries management arrangements, research, and compliance/management costs. The MACs also provide a link between AFMA and those with an interest in the fishery, with membership generally comprising members from commercial industry, fisheries management, the scientific community, the environment/conservation sector and, in some instances, the State governments.
Under the FMA, ‘plans of management’, or fisheries management plans (FMPs) as they are known, are the way arrangements are set for each fishery. The FMA requires consultation with the public on draft FMPs and provides for ministerial oversight. Under the Act AFMA must set out in writing a FMP for each fishery or, likewise in writing, explain why one is not needed and provide draft plans for public display so interested persons can make representations.
CRITERIA: (iii) The management policy has clear long-term objectives to guide decision making that are consistent with the outcomes expressed by Components 1 and 2, and incorporates the precautionary approach.
| (a) Objectives |
LOW RISK |
|
The long term objectives of the management system are specified in the FMA and the EPBC Act, and further defined in the Commonwealth Fisheries Harvest Strategy Policy and Guidelines. The objectives and policy guidance are consistent with Components 1 and 2 and explicitly require application of the precautionary principle. The fishery is also subject to the Commonwealth EPBC Act which requires periodic assessment against the Guidelines for the Ecologically Sustainable Management of Fisheries. These Guidelines are consistent with the MSC Principles and encourage practical application of the ecosystem approach to fisheries management.
PI SCORE – LOW RISK
3B: Fishery Specific Management System
CRITERIA: (i) The fishery specific management system has clear, specific objectives designed to achieve the outcomes expressed by Components 1 and 2.
| (a) Objectives |
LOW RISK |
|
Well defined and measurable short and long term objectives, which are demonstrably consistent with achieving the outcomes expressed by Components 1 and 2, are explicit within the fishery’s management system. The SESSF Management Plan 2003 (amended in 2009) reinforces the objectives of the FMA as the objectives of the Plan. These are consistent with Australia’s obligations under international arrangements, national legislation and specifically require application of the precautionary principle. Fishery specific objectives can be identified in the Harvest Strategy and SESSF ERM Strategy.
CRITERIA: (ii) The fishery specific management system includes effective decision making processes that result in measures and strategies to achieve the objectives.
| (a) Decision making |
LOW RISK |
|
Australia’s Commonwealth fisheries decision making process is well established and set out explicitly in relevant legislation (e.g. FMA, FAA) and policy documents (e.g. Looking to the Future, Commonwealth Harvest Strategy Policy). The decision making processes by AFMA based on advice from SEMAC, working with SESSFRAG, are transparent with feedback provided by the Commission directly to SEMAC and to stakeholders through media such as the regular AFMA Update and through the Annual public meeting of both the MAC and AFMA. There are numerous examples in the last decade of the CTS management system responding to serious and other matters (e.g. TACC adjustments based on the harvest strategy, ERM reports based on the outcomes of ERAs, deepwater shark closures etc).
|
b) Use of the Precautionary approach |
LOW RISK |
The objectives and policy guidance of the SESSF explicitly require application of the precautionary principle and there is generally very good evidence that a precautionary approach is applied. For example, the HSF explicitly increases the level of precaution as uncertainty increases (e.g. through discount factors in TAC setting for lower Tier stocks) (AFMA, 2017a). The ERA methodology also accounts for uncertainty by being precautionary (e.g. through the classification of species as ‘precautionary high risk’ where sufficient uncertainty exists). There is some uncertainty around whether the rebuilding plan for eastern Gemfish is sufficiently precautionary in the context of persistent low recruitment conditions experienced in recent years.
| (c) Accountability and Transparency |
LOW RISK |
|
The AFMA website contains an extensive list of evaluations, research reports and assessments, and evidence exists within the SEMAC and the RAG that decisions respond to these findings. South East MAC (SEMAC) meeting minutes are also available online[1]. AFMA provide monthly and annual reports, which outline program outcomes and, provide a means for measuring success.
[1] e.g. http://www.afma.gov.au/wp-content/uploads/2014/08/SEMAC-December-2014-meeting-minutes.pdf
CRITERIA: (iii) Monitoring, control and surveillance mechanisms ensure the management measures in the fishery are enforced and complied with.
| (a) MCS Implementation |
LOW RISK |
|
AFMA’s framework for its National (Domestic) Compliance and Enforcement Program is set out in the AFMA National Compliance Operations and Enforcement Policy (AFMA, 2015d). The policy is compliant with the Australian Fisheries National Compliance Strategy 2010-15 and aims to “effectively deter illegal fishing in Commonwealth fisheries and the Australian Fishing Zone”. Compliance activities are informed by risk assessments undertaken in accordance with the international standard for risk management (ISO 31000:2009) across all major Commonwealth domestic fisheries (AFMA, 2015d). Compliance operations are supported through a centralised structure with separate Intelligence, Planning and Operations units.
More specific annual compliance priorities and risk treatments are set out in AFMA’s National Compliance and Enforcement Program 2016 -17 (AFMA, 2015e). Key priorities for 2016-17 include (i) failure to have a Vessel Monitoring System (VMS) or Electronic Monitoring (emonitoring) system operating at all times, (ii) quota evasion and (iii) bycatch mishandling, which has been identified as an emerging risk. Risks are treated through a program of general deterrence (i.e. inspections and patrols designed to target identified high risk ports, boats and fish receivers), and other targeted measures – e.g. physical and technical surveillance, standard investigative activity, intelligence gathering, and media strategies. Compliance Risk Management Teams (CRMTs) may be formed to help address priority risks (e.g. VMS/electronic monitoring offences; quota evasion).
These measures constitute a system which has demonstrated an ability to enforce management measures.
| (b) Sanctions and Compliance |
LOW RISK |
|
A framework of sanctions for non-compliance is set out in the FMA, Maritime Powers Act 2013 and Fisheries Management Regulations 1992. These include powers to issue warnings, cautions, directions, Observer Compliance Notices, Commonwealth Fisheries Infringement Notices (CFINs), amend fishing concession conditions, suspend or cancel fishing concessions and prosecute offenders through the courts (AFMA, 2015d). Some evidence exists that fishers comply with the management system including providing information of importance to the effective management of the fishery. Across all years between 2011-12 and 2015-16, no action was required in >90% of boat inspections in Commonwealth fisheries (total inspections 879) (AFMA, 2015e). A 2013 audit of the management of the AFMA Domestic Compliance system did not highlight systematic non-compliance (ANAO, 2013).
CRITERIA: (iv) There is a system for monitoring and evaluating the performance of the fishery specific management system against its objectives.
There is effective and timely review of the fishery specific management system.
| (a) Evaluation coverage |
LOW RISK |
|
Performance of all stocks against the SESSF Harvest Strategy are assessed annually through the RAG and MAC process. TACs are adjusted annually based on updated stock assessments and RAG/MAC/AFMA advice. Periodic updates of ERAs evaluate performance against environmental objectives and guide management priorities. Fishery Status Reports produced annually by the Australian Bureau of Agricultural and Resource Economics and Sciences (ABARES) provide an independent evaluation of key parts of the management system (e.g. stock status, overfishing status). In addition, two Australian National Audit Office reviews have been undertaken into the domestic compliance program (2009, 2013). Accordingly, the fishery has measures in place to evaluate key parts of the management system.
| (b) Internal and/or external review |
LOW RISK |
|
The fishery-specific management system is subject to regular internal review through the SEMAC process, which tracks performance of the fishery against the objectives in the Management Plan. AFMA is also required to report in its Annual Report on overall performance against the legislative objectives, statutory requirements and financial reporting, the effectiveness of internal controls and adequacy of the Authority’s risk management processes.
The fishery is subject to regular external assessment through the ongoing assessment for export approval under the EPBC Act against the Guidelines for the Ecologically Sustainable Management of Fisheries. Moreover, ABARES reports on the ecological and economic sustainability of fisheries managed by AFMA and the Australian National Audit Office undertakes periodic reviews of aspects of AFMA’s performance (e.g. ANAO, 2013).
PI SCORE – LOW RISK
Acknowledgements
This seafood risk assessment procedure was originally developed for Coles Supermarkets Australia by MRAG Asia Pacific. FRDC is grateful for Coles’ permission to use its Responsibly Sourced Seafood Framework.
It uses elements from the GSSI benchmarked MSC Fishery Standard version 2.0, but is neither a duplicate of it nor a substitute for it. The methodology used to apply the framework differs substantially from an MSC Certification. Consequently, any claim about the rating of the fishery based on this assessment should not make any reference to the MSC.