
Saddletail Snapper – Northern Territory Demersal Fishery
Assessment Summary
Fishery Overview
This overview is adapted from NTG (2017):
The NT Demersal Fishery extends out from 15 nm from the low water mark to the outer limit of the AFZ (excluding the area of the Timor Reef Fishery) and targets a range of tropical snappers (Lutjanus spp. and Pristipomoides spp.) using a variety of gear. Fish traps, hand lines and droplines are permitted throughout the fishery and demersal trawl nets are permitted in two defined zones (Figure 1).
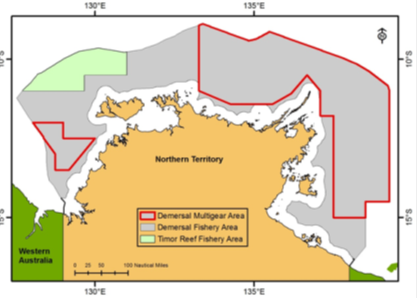
Figure 1: Map of the NT Demersal Fishery (grey area). Red lines indicate trawl area (NTG, 2014).
The harvest by the Demersal Fishery is limited by TACs applied to Golden Snappers (Pristipomoides spp.) (400 t), Saddletail Snapper (L. malabaricus) and Crimson Snapper (L. erythropterus) (2500 t) and a “grouped fish” category (915 t). The latter group includes all fishes other than Barramundi (Lates calcarifer), King Threadfin (Polydactylus macrochir), Spanish Mackerel (Scomberomorus commerson), shark and Mud Crabs (Scylla spp.).
A total of 3107 t of fish was harvested by Demersal Fishery licensees in 2015. Red snappers (Saddletail and Crimson Snapper) and Golden Snappers formed the bulk of the harvest (74 per cent and 9 per cent, respectively) with Painted Sweetlip (Diagramma labiosum) being the primary byproduct species (4 per cent of the total). Reported bycatch of other species (by weight) during 2015 was less than 1 per cent of the dropline and trap harvest and the average bycatch recorded by observers for the trawl harvest in 2015 was 20 per cent of reported landed catch. Non-retained species included trevallies, scads (Family Carangidae) and sharks. On-board observers routinely verify the proportion and composition of bycatch in the trawl component of this fishery.
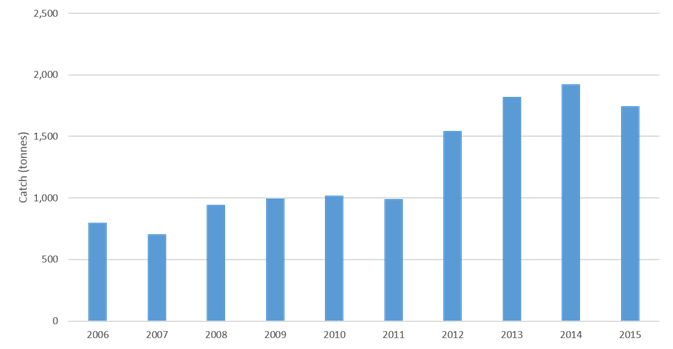
Figure 2 Trend in total catch (Includes Demersal Fishery, Coastal Line Fishery, Timor Reef Fishery)
Risk Scores
|
Performance Indicator |
Saddletail Snapper |
Saddletail Snapper |
|
MEDIUM |
MEDIUM |
|
|
1A: Stock Status |
LOW |
LOW |
|
1B: Harvest Strategy |
PHR |
PHR |
|
1C: Information and Assessment |
MEDIUM |
MEDIUM |
|
C2 ENVIRONMENTAL IMPACT OF FISHING |
LOW |
LOW |
|
LOW |
LOW |
|
|
2B: ETP Species |
LOW |
LOW |
|
2C: Habitats |
LOW |
LOW |
|
2D: Ecosystems |
LOW |
LOW |
|
C3 MANAGEMENT |
LOW |
LOW |
|
3A: Governance and Policy |
LOW |
LOW |
|
3B: Fishery-specific Management System |
LOW |
LOW |
Summary of main issues
Saddletail Snapper
- The multi-species nature of the current catch controls means there is scope for individual species to be harvested above MSY levels. It is not clear that the current combined TACCs for Saddletail Snapper and Crimson Snapper across both the Demersal Fishery and Timor Reef Fishery, if caught, would maintain stocks at levels with high productivity and low probability of recruitment overfishing. Nevertheless, stocks of these species are currently estimated to be above levels consistent with MSY with no evidence of
- There are no well-defined harvest control rules (HCR) which link to the state of the stock and set out pre-agreed measures to reduce exploitation as the PRI is approached;
- The most recent stock assessments for Saddletail Snapper have not been publicly released.
- Both trawl and trap/line sectors appear relatively well-placed against C2 and C3 performance indicators.
Outlook
Saddletail Snapper – Trawl, Trap/Line
| Component | Outlook | Comments |
| Target fish species | Improving | A new harvest strategy for the Demersal Fishery is expected to be developed consistent with a new Northern Territory Fisheries Harvest Strategy Policy. |
| Environmental impact of fishing | Stable | No major changes expected. |
| Management system | Stable | The fishery is generally well-placed against Component 3 indicators. No major changes expected. |
COMPONENT 1: Target species
1A: Stock Status
CRITERIA: (i)The stock is at a level which maintains high productivity and has a low probability of recruitment overfishing.
| (a) Stock Status |
LOW RISK |
|
Saddletail Snapper is a widespread Indo-Pacific species found from Shark Bay in Western Australia, across northern Australia to the east coast of Queensland (Martin et al, 2016a). Genetic studies indicate that the species is comprised of three biological stocks: the North Coast Bioregion biological stock, the Northern Australian biological stock (including the Timor Sea, Arafura Sea and the Gulf of Carpentaria) and the East coast of Queensland biological stock.
This assessment evaluates stock status of the Northern Australian stock.
Martin et al (2016a) report that “this cross-jurisdictional biological stock has components in the Northern Territory and Queensland. Each jurisdiction assesses that part of the biological stock that occurs in its waters. Status presented here for the entire biological stock has been established using evidence from both jurisdictions.
For the Northern Territory component of this biological stock (where most of the commercial catch is taken), Saddletail Snapper was assessed in 2013 using a stochastic stock reduction analysis (SRA) model. Egg production in 2013 was estimated to be around 80 per cent of that prior to the start of the fishery. This part of the stock is not considered to be recruitment overfished.
The Northern Territory manages the commercial harvest of Saddletail Snapper and Crimson Snapper together as ‘red snappers’ with a combined total allowable commercial catch of 3800 t. Saddletail Snapper has averaged 78 per cent of the annual red snapper catch over the past 10 years, with the 2015 commercial catch of this species being 1756 t. Trawl effort and catch per unit effort have both increased since 2012. The 2013 assessment indicated that the current harvest rate of Saddletail Snapper is well below that required to achieve maximum sustainable yield (MSY). This level of fishing pressure is unlikely to cause this part of the stock to become recruitment overfished.
For the Queensland part of the biological stock, commercial catch in 2015 was 67 t, constituting four per cent of the total 2015 Saddletail Snapper catch from the biological stock. This contrasts with catches of 150–250 t per year during the period 2006–11 and catches of 0–23 t during the period 2012–14. The MSY for this part of the stock is approximately 150 t and the average catch from 2006–15 was slightly below this level. This part of the stock is not considered to be recruitment overfished”. Accordingly, there is evidence that the stock is highly likely to be above the point of recruitment impairment (PRI) and also likely to be fluctuating at or above a level consistent with MSY.
PI SCORE – LOW RISK
1B: Harvest Strategy
CRITERIA: (i)There is a robust and precautionary harvest strategy in place.
| (a) Harvest Strategy |
PRECAUTIONARY HIGH RISK |
|
The Northern Australian biological stock of Saddletail Snapper is harvested commercially by the Northern Territory (NT) DF, Timor Reef Fishery (TRF) and CLF, as well as the Queensland Fisheries Joint Authority (QFJA) managed Gulf of Carpentaria Developmental Fin Fish Trawl Fishery (GOCDFFTF). The substantial majority of the catch is taken in the trawl sector of the DF. In 2015, a total of 1756t of Saddletail Snapper was harvested in NT commercial fisheries, with 67t harvested in the Queensland GOCDFFTF. Small quantities are also harvested by recreational fishers and Fishing Tourism Operators (FTO) in the NT and the Gulf of Carpentaria.
The main management measures forming the harvest strategy in the DF and TRF are set out in the NT Fisheries Regulations 1993. For the DF, the cornerstone of the harvest strategy is a commercial quota system applying across the all gear types, introduced in 2012 (DPIF, 2012a). Under the quota arrangements, separate TACs are set for three species groupings:
- 400,000kg for Goldband Snapper (applying across three species – multidens, P.typus, P. filamentosus);
- 2,499,980kg for Saddletail Snapper and Crimson Snapper ( malabaricus and L. erythropterus); and
- 914,960kg for all other species combined.
Within the TAC, each operator’s catch is controlled through holdings of fishery quota units (units are a proportion of the TAC). At the time of the quota system’s introduction, the fishery comprised 60 Demersal Fishery licenses (using drop line or trap gear) and one fin fish trawl license, although not all of these were active. In 2016, four trawl vessels 1-3 trap/line vessels were operating (NTFJA, 2016).
Catch and quota compliance in the fishery is monitored through a comprehensive system of notices and records. These include mandatory pre-departure and prior landing notices, as well as the submission of unloaded fish notices and catch disposal records. The unloaded fish notice records the weight of the fish landed at certified scales. License holders are also required to complete a compulsory logbook recording catches of all retained species daily, estimated bycatch discarded and other key information such as fishing effort and location. Vessels are also monitored by VMS and independent observers, with 31 fishing days observer coverage in 2015 (NTG, 2017).
Additional management measures applied in the trawl sector include:
- Spatial restriction through area closures;
- Minimum trawl mesh size of 110mm;
- Prohibition on the use of a double codend liner;
- Restriction on the total weight of the footline to not more than 4kg per lineal meter;
- Maximum mesh size and ply strength in the forward half of the net set at 90 ply by 400 denier.
Additional management measures applied in the trap/line sector include:
- Restricted to waters from 20nm from the coast to the boundary of the Australian Fishing Zone;
- Prohibition of automatic baiting and longlining;
- Droplines restricted to a maximum of 40 hooks;
- Traps cannot be attached together.
A commercial quota system is also applied in the TRF, which uses trap and line gear to target a similar suite of species as the DF. TACs are set across the same three species groupings as the DF and are currently set at:
- 899 998kg for Goldband Snapper (applying across three species – multidens, P.typus, P. filamentosus);
- 1 300 002kg for Saddletail Snapper and Crimson Snapper ( malabaricus and L. erythropterus); and
- 415 008kg for other species combined.
Additional management measures applied in the TRF include:
- Restrictions to trap and line apparatus;
- A requirement for a minimum quota holding prior to the start of each trip;
- Requirement to submit notices prior to landing and unload;
- Traps cannot be attached together.
The main monitoring for both fisheries is through compulsory commercial logbooks and unloading forms. Stock assessments have been periodically undertaken for Saddletail Snapper (Grubert et al. 2013; NTG, 2016a).
In the GOCDFFTF, effort is limited through the number of non-transferable permits (3) as well as through catch limits. For the years 2004–2014, the fishery Total Allowable Commercial Catch (TACC) was fixed at 1250 t and substantially under-caught. For the 2015 calendar year, a revised 450 t harvest quota was set for Crimson Snapper, Saddletail Snapper, Red Emperor and other Emperor species, based on updated estimates of MSY for east Gulf of Carpentaria waters (Leigh and O’Neill, 2016).
Recreational catch is small compared to commercial catch for the northern Australian biological stock (Martin et al 2016a).
For the red snappers, the combined NT DF/TRF TAC of 3,800t is well above the 2015 catch of either species (1756t for Saddletail Snapper and 684t for Crimson Snapper) and available evidence suggests may be well above MSY. O’Neill et al (2011) estimated an approximate MSY of 2406 t for red snappers for the whole of the NT fishery (Timor Reef, Arafura Sea and the NT Gulf of Carpentaria). Using stock reduction analysis (SRA), Martin (2013) estimated MSY for Saddletail Snapper across all three regions of the NT was in the range of 1500–2000 t. An unpublished 2015 update of the SRA estimated Saddletail Snapper MSY at approximately 1900 t and a combined NT red snapper MSY of 2375 t (Leigh and O’Neill, 2016).
To score medium risk against this indicator, the harvest strategy must be expected to achieve the stock management objectives reflected in criterion 1A(i). To meet low risk, the harvest strategy must also be demonstrated to be responsive to the state of the stock with all elements working together to achieve the stock management objectives reflected in criterion 1A(i).
While many of the elements of an effective harvest strategy appear to be in place, it is not clear at this stage that a combined TAC of 3,800t, if caught, would maintain red snapper stocks at levels which ensure high productivity and a low probability of recruitment overfishing. Given that catches of Saddletail Snapper have generally increased over the past decade, there is potential for at least some of the unused portion of the TAC to be caught (although different targeting practices in the main fisheries may prevent catch increases in the short term). While a framework of trigger points exists requiring management reviews and additional data gathering (DPIF, 2012a), there is currently no well-defined HCR which would act to reduce exploitation if the PRI was approached for Saddletail Snapper. Accordingly, the UoA does not meet the medium risk SG. Nevertheless, the most recent published estimates for Saddletail Snapper suggest that stocks are likely to be at or above BMSY, and that current catches are below the level likely to produce MSY. On that basis, and under current conditions of TAC undercatch, we have scored this SI precautionary high risk.
| (b) Shark-finning |
|
|
NA
CRITERIA: (ii) There are well defined and effective harvest control rules (HCRs) and tools in place.
| (a) HCR Design and application |
MEDIUM RISK |
|
While arrangements are in place that allow for the adjustment of TACC levels in response to new information, and a set of decision rules and trigger points have been developed (DPIF, 2012a), they do not currently link clearly to the state of the stock nor set out pre-agreed response to reduce exploitation. For example, when 80% of the TACC is reached for Saddletail Snapper and Crimson Snapper, a “review of the appropriateness of the current TACC is undertaken using all data”. Defined management responses which would serve to reduce the exploitation rate as the PRI is reached are not specified. Accordingly, “well-defined” HCRs are not in place and the fishery cannot score low risk.
Nevertheless, the stock biomass for Saddletail Snapper appears never to have been reduced below MSY and the decision rules framework provides some confidence that managers will take action to reduce exploitation as the PRI is approached. A series of indicators are monitored and trigger points commit the management agency to a specified action (e.g. management review, additional data gathering). Where these actions identify negative trends, tools exist through the quota management framework to reduce exploitation where necessary. On this basis, the existing arrangements could be interpreted as having generally understood HCRs ‘available’ and consistent with medium risk.
A similar framework of operational decision rules exists for the TRF (NTG, 2012).
We note that the Northern Territory Government has recently released a Northern Territory Fisheries Harvest Strategy Policy which requires that harvest strategies with well-defined HCRs be implemented in all key NT fisheries when their respective fishery regulations or management plan is next reviewed (DPIR, 2016). Future assessments of the fishery should take into account any developments under the policy.
PI SCORE – PRECAUTIONARY HIGH RISK
1C: Information and Assessment
CRITERIA: (i) Relevant information is collected to support the harvest strategy.
| (a) Range of information |
LOW RISK |
|
Notwithstanding some ongoing uncertainties, considerable work has been undertaken on the stock structure of red snappers in the Arafura and Timor Sea region (e.g. Blaber et al. 2005; Salini et al. 2006). A number of studies have also been undertaken on the biology of the target species both in the region of the NTDF and in adjacent fisheries. Good information is available on each of the commercial fleets harvesting Saddletail Snapper, and periodic recreational fishing surveys are undertaken (e.g. West et al, 2012). Indigenous harvest is thought to be small. Existing information is sufficient to support the harvest strategy.
| (b) Monitoring and comprehensiveness |
LOW RISK |
|
Stock abundance and catch removal data are available from commercial and charter logbooks, periodic observer data, catch reporting arrangements and periodic stock assessments to support the quota system (e.g. Grubert et al. 2013, NTG, 2016a). Although there are no biologically-based harvest control rules in the fishery, the decision rules framework contains several indicators that are monitored annually to evaluate the harvest strategy and provide triggers for management action.
CRITERIA: (ii) There is an adequate assessment of the stock status.
| (a) Stock assessment |
MEDIUM RISK |
|
Martin (2013) assessed the Northern Territory component of the biological stock (where most of the commercial catch is taken) in 2013 using a stochastic stock reduction analysis (SRA) model, although the report is unpublished. SRA is a population dynamics model that incorporates key parameters on unfished recruitment, survival, recruitment compensation from harvest, growth characteristics, maximum size, age at birth, length-weight relationship and size at maturity that describe the underlying production and carrying capacity of a population over time (Walters et al, 2006). Estimates of biomass and egg production relative to unfished levels are produced, as well as estimates of the likelihood that the fishery is causing overfishing (Grubert et al. 2013). Leigh and O’Neill (2016) report that the SRA was updated in 2015 using data to 2014. O’Neill et al (2011) used an age-structured population dynamic model to estimate MSY across six species, including Saddletail Snapper, in the eastern Gulf of Carpentaria. Although the SRA model is likely to be appropriate for the stock and estimate status relative to reference points, the details of the assessment are not yet published. The assessment appears to estimate status relative to generic reference points (e.g. MSY), consistent with the medium risk SG. The UoA may score low risk if the details of the assessment were made public.
| (b) Uncertainty and Peer review |
MEDIUM RISK |
|
The red snapper assessment is not publicly available although reportedly uses stochastic stock reduction analysis (SRA) model (Martin 2016a). While SRA models are known to take uncertainty into account, the extent to which this occurred is unable to be assessed and it is not known whether the outputs were peer reviewed. Accordingly, we have scored this SI medium risk.
PI SCORE – MEDIUM RISK
COMPONENT 2: Environmental impact of fishing
2A: Other Species
CRITERIA: (i) The UoA aims to maintain other species above the point where recruitment would be impaired (PRI) and does not hinder recovery of other species if they are below the PRI.
| (a) Main other species stock status |
LOW RISK |
|
The intent of this scoring issue is to examine the impact of the UoA on ‘main’ other species taken while harvesting the target species. ‘Main’ is defined as any species which comprises >5% of the total catch (retained species + discards) by weight in the UoA, or >2% if it is a ‘less resilient’ species. The aim is to maintain other species above the point where recruitment would be impaired and ensure that, for species below PRI, there are effective measures in place to ensure the UoA does not hinder recovery and rebuilding. Black Jewfish is a minor catch in this fishery but has been assessed under Component 1 in the full assessment report.
NTG (2017) report that Red Snappers and Golden Snappers formed the bulk of the harvest (74 per cent and 9 per cent, respectively) in the DF with Painted Sweetlip (Diagramma labiosum) being the primary byproduct species (4 per cent of the total). Reported bycatch (by weight) during 2015 was less than one per cent of the total dropline and trap harvest and the average bycatch recorded by observers for the trawl harvest in 2015 was 20 per cent.
The most abundant bycatch species in the trawl sector are a variety of trevally and scads (Carangidae) (NTG, 2012b; 2017). Sharks and rays reportedly make up a high proportion of discards by weight although are almost always released live, consistent with a regulation prohibiting their retention. The presence of larger species, such as sharks and rays, has declined as a result of improvements in design of the Bycatch Reduction Device (BRD) (NTG, 2012b). DRDPIFR (2009) assessed the ecological risks associated with the trawl sector on eight target and bycatch species/groups (Crimson Snapper, Golden Snapper, Redspot Emperor, Painted Sweetlip, Purple Spotted Bigeye [Priacanthus tayenus], scads, trevally, sharks and rays) rating the risk to each as negligible. Nevertheless, we note that effort in the trawl sector has increased in recent years and the risk assessment should be updated.
The trap gear tends to catch very few species that are discarded, although some poisonous fish such as Chinaman Fish and Red Bass and some unmarketable fish such as Trigger Fish and Catfish are discarded. Longline gear is very seldom used in the fishery but there are some sharks as well as the above trap bycatch species that are discarded. DBIRD (2003) note “the fishing methods used, baited drop lines and traps, rely upon passive means of capture which exclude the majority of bycatch species caught in the 1990 and 1992 trawl surveys. In addition, the size of hooks used (11/O-13/O) and mesh size of traps (75mm X 50mm) effectively exclude the majority of demersal species found on the grounds, while allowing the large and commercially valuable snapper species to be targeted. Currently bycatch levels are at less than 1% of the total annual catch.” DRDPIFR (2009) assessed the risk of the trap/line sector to four bycatch species (Chinaman fish, red bass, bigeye trevally and trigger fish) rating each as negligible.
Based on the reported catch composition of both sectors, as well as low impact on non-target species, we have assessed Crimson Snapper as the only main other species in the trawl sector and both Golden Snappers and Crimson Snapper as main other species in the trap/line sector.
Crimson Snapper
Martin et al (2016b) report that Crimson Snapper is assessed on the basis of the status of Saddletail Snapper as an indicator for the combined red snappers group. Preliminary analysis using the MSC’s Risk-Based Framework indicates that the productivity scores for both species are comparable. Based on the outcomes of the Saddletail Snapper assessment (see above), Martin et al (2016b) conclude that the Crimson Snapper stock is unlikely to be recruitment overfished.
Golden Snappers
Golden Snappers (Pristipomoides multidens, P.typus and P. filamentosus) are a key target species for the trap/line sector, with P. multidens accounting for >90% of the Golden Snapper catch (DRDPIFR, 2009).
Martin et al (2016c) report that the Northern Australian Goldband Snapper biological stock was assessed in 2011 and 2013 using a stochastic stock reduction analysis (SRA) model. Egg production was estimated to be around 65 per cent of that prior to the start of the fishery, well above conventional fisheries target levels. The above evidence indicates that the biomass of this stock is unlikely to be recruitment overfished.
Accordingly, there is evidence that both species are highly likely to be above PRI.
CRITERIA: (ii) There is a strategy in place that is designed to maintain or to not hinder rebuilding of other species; and the UoA regularly reviews and implements
(a) Management strategy in place
| Trawl |
MEDIUM RISK |
|
The harvest strategy for Crimson Snapper in the trawl sector is the same as that described for Saddletail Snapper in 1B above, these species being combined for management purposes in the group red snappers. Similar to Saddletail Snapper, the main weakness is that the combined TAC for red snappers across the DF and TRF fisheries is set well above the estimated MSY (O’Neill et al, 2011; Martin, 2013; Leigh and O’Neill, 2016). Increases in Crimson Snapper catch in 2015 (100% increase over 2014) (NTG, 2017) demonstrate that there is scope for increases in catch within the current trawl TAC. While existing arrangements allow for catches in excess of MSY, the current level of fishing pressure is unlikely to cause the stock to become recruitment overfished (Martin et al, 2016b), the status of the stock is assessed regularly using saddletail as an indicator species and a framework of trigger points exists that could be expected to result in management change should the stock be approaching PRI. To that end, the UoA has measures in place that that are expected to maintain or to not hinder rebuilding of the main other species at/to levels which are likely to be above the PRI. Nevertheless, as with Saddletail Snapper the UoA would be better placed with well-defined HCRs which ensure exploitation is reduced as the PRI is approached.
| Trap/Line |
MEDIUM RISK |
|
The measures in place to manage exploitation of Crimson Snapper and Golden Snapper in the trap/line sector are described under 1B above. For Crimson Snapper the measures are consistent with the medium risk SG, for the reasons described under ‘trawl’ above. For Golden Snapper, Grubert et al (2013) concluded that there was a high degree of certainty (98% probability) that the current harvest rate is below that required to achieve MSY (using data to 2011). Catches in 3 of the 4 years between 2012 and 2015 have been lower than in 2011 (NTG, 2017). The main uncertainty is the extent to which the existing combined TAC across the NT of 1300t (400t in the DF and 900t in the TRF) allows for catches above the MSY level. Nevertheless, as with Crimson Snapper, the status of the stock is assessed regularly and a framework of trigger points exists that could be expected to result in management change should the stock be approaching PRI. To that end, the UoA has measures in place that that are expected to maintain or to not hinder rebuilding of the main other species at/to levels which are likely to be above the PRI.
| (b) Management strategy evaluation |
LOW RISK |
Regular stock assessments of Golden Snapper and Saddletail Snapper as an indicator for Crimson Snapper provide some objective basis that the strategy will work.
| (c) Shark-finning |
NA
CRITERIA: (iii) Information on the nature and amount of other species taken is adequate to determine the risk posed by the UoA and the effectiveness of the strategy to manage other species.
| (a) Information |
LOW RISK |
Information on the main retained species is collected via commercial logbooks, through annual observer coverage and through catch returns submitted as part of quota compliance arrangements. Collectively, these programs provide quantitative information which is adequate to assess the impact of the UoA on main other species with respect to status and to detect any increased risk.
The main weaknesses in the monitoring of non-target species appears to be the lack of estimates of discarded species by weight and the lack of species specific information for some groups (e.g. trevally).
PI SCORE – LOW RISK
2B: Endangered Threatened and/or Protected (ETP) Species
CRITERIA: (i) The UoA meets national and international requirements for protection of ETP species.
The UoA does not hinder recovery of ETP species.
(a) Effects of the UoA on populations/stocks
| Trawl |
LOW RISK |
|
NTG (2017) report that “the Demersal Fishery operates beyond the geographic range of many ETP species and so the risk of interaction with this group of species is low. Turtle excluder devices are required by law and square mesh codends are used voluntarily to reduce the retention of non-target species and increase the value of the landed product. Fishery observers reported eight TEPS interactions during 31 days of fishing in 2015. Bycatch species included sea snakes, Narrow Sawfish (Anoxypristis cuspidata) and a Grey Nurse Shark (released alive)”. Fishery observers reported 18 ETP species interactions during 40 days of fishing in 2014 (NTG, 2016a). In 2014, interactions were reported with sea snakes, Narrow Sawfish (Anoxypristis cuspidata, dead), two dolphins (dead) and a turtle (released alive) (NTG, 2016a).
Neither the Australian or NT Government’s set numerical limits on the number of the above species that may be incidentally captured in the fishery. Based on the low rates of interaction, the direct effects of the UoA appear highly unlikely to hinder recovery of ETP species. These outcomes are consistent with the ERA undertaken in 2009 which rated the risk to ETP species as negligible (DRDPIFR, 2009), although NTG (2016b) indicate there would be benefit in updating the ERA given increases in fishing effort since 2011.
| Trap/Line |
LOW RISK |
|
DBIRD (2003) report of the adjacent Timor Reef Fishery (TRF) which uses the same apparatus “fisheries observer data has been collected from the inception of the Timor Reef fishery in 1989 (Lloyd et al. 1999). Throughout this period, there has been no recorded interaction with endangered, threatened or protected species. The fishing gear, either drop lines or traps, and the depth at which they are set (80 -120 m), means that it is unlikely to interact with these listed species.” NTG (2016b) report that no interactions have been recorded in the trap and line sector, by observers or in logbooks.
These outcomes are consistent with the ERA undertaken in 2009 which rated the risk to ETP species from the trap/line sector as negligible (DRDPIFR, 2009).
CRITERIA: (ii) The UoA has in place precautionary management strategies designed to:
- meet national and international requirements; and
- ensure the UoA does not hinder recovery of ETP species.
(a) Management strategy in place
| Trawl |
LOW RISK |
|
The main management measure used to limit the impact of the fishery on ETP species is the use of bycatch reduction grids in trawl gear. Overall limits on licenses, catch of quota species and limits on the spatial area of the fishery are also likely to further reduce interactions. All interactions with protected species are required to be recorded in logbooks, and interactions are independently monitored by DPIF annually by onboard observers (31 fishing days in 2015) (NTG, 2017). Objectives, performance indicators and trigger points for ETP species interactions are set out in the decision rules framework for the fishery and aim to maintain interactions at 2012 levels (NTG, 2015). These measures are likely to be considered a strategy which is expected to ensure the fishery does not hinder recovery of ETP species.
| Trap/Line |
LOW RISK |
|
The main measures in place are the restrictions on gear (design and number) and limited entry into the fishery. All interactions with protected species are required to be recorded in logbooks, and interactions are independently monitored by DPIF. Given the very low levels of recorded interaction, these measures are likely to be considered a strategy which is expected to ensure the fishery does not hinder recovery of ETP species.
(b) Management strategy implementation
| Trawl, Trap/Line |
LOW RISK |
|
The outcomes of the 2009 ERA (DRDPIFR, 2009) rating risk to ETP species in both sectors as negligible, together with low rates of interaction reported by observers, provides some objective basis for confidence that the strategy will work and the measures are being implemented successfully. Accordingly, we have scored this SI low risk. Nevertheless, we note the recommendation in NTG (2016b) to update the ERA in light of increased effort in the trawl sector since 2011. Future assessments should take into account the outcomes of any ERA update.
CRITERIA: (iii) Relevant information is collected to support the management of UoA impacts on ETP species, including:
- information for the development of the management strategy;
- information to assess the effectiveness of the management strategy; and
- information to determine the outcome status of ETP species.
(a) Information
| Trawl |
MEDIUM RISK |
|
All ETP species interactions must be reported in commercial daily catch logs recording the type of interaction, species and whether it was released alive or dead. In addition, independent observers provide some level of independent monitoring of rates of interaction (NTG, 2016; 2017). While rates of observer coverage are relatively low, information available through logbooks and observers provides some quantitative information to assess the level of mortality associated with each sector and to support a strategy to manage impacts. Nevertheless, NTG (2016b) notes that observer data are considered more reliable than logbook reports and reporting from non-observed trips should be improved. To that end, there is some uncertainty around the adequacy of the available quantitative information to assess UoA related mortality and we have scored this SI medium risk.
| Trap/Line |
LOW RISK |
|
All ETP species interactions must be reported in commercial daily catch logs recording the type of interaction, species and whether it was released alive or dead. In addition, independent observers provide some level of independent monitoring of rates of interaction (NTG, 2017). No interactions have been recorded in the trap and line sector, by observers or in logbooks (NTG, 2016b). This information is adequate to assess the level of mortality associated with each sector and to support a strategy to manage impacts.
PI SCORE – LOW RISK
2C: Habitats
CRITERIA: (i) The UoA does not cause serious or irreversible harm to habitat structure and function, considered on the basis of the area(s) covered by the governance body(s) responsible for fisheries management
(a) Habitat status
| Trawl |
LOW RISK |
|
Examples of “serious or irreversible harm” to habitats include the loss (extinction) of habitat types, depletion of key habitat forming species or associated species to the extent that they meet criteria for high risk of extinction, and significant alteration of habitat cover/mosaic that causes major change in the structure or diversity of the associated species assemblages (MSC, 2014).
The potential impact of the fishery on habitats and ecosystem structure and function is addressed by DBIRD (2003). Broadly, they conclude that the limited number of operators in the fishery (one vessel then, four now) together with the very large area of the fishery and the design of the gear used would likely combine to result in a negligible impact on habitats or ecosystem function.
A number of studies have been undertaken assessing the benthic impact of the semi-demersal ‘Wendy’ trawl gear used in the fishery. For example, Moran and Stephenson (2000) tested similar semi-demersal trawl gear on the continental shelf of north-western Western Australia, which is likely to have a similar habitat structure as the area fished by the NTDF. These authors concluded the gear had ‘no measurable effect’ on the benthic community (whereas standard demersal trawl gear reduced benthos density by 15.5% on each tow).
NTG (2017) report that the trawl gear used by the Demersal Fishery does disturb the benthic environment and the area impacted in 2015 was 1.6 per cent of the total areas zoned for trawling (1.17% in 2014; NTG, 2016a).
The very limited spatial coverage of the fishery, together with studies showing limited benthic impact from the type of gear used in the fishery, indicate that the fishery is highly unlikely to reduce habitat structure and function to a point where there would be serious or irreversible harm.
| Trap/Line |
LOW RISK |
|
The footprint of trap and longline gear is likely to be orders of magnitude lower than the fish trawl sector as a consequence of their passive fishing strategy. NTG (2016a) reports that in 2014, trap gear covered less than 0.0001% of the total fishery area. Additionally, research overseas of similar style fish traps used in similar habitat have shown that habitat impact on the most sensitive biota such as gorgonia coral is negligible (Shester and Micheli, 2011). Demersal longlines have also been demonstrated to have minimal impacts on bottom habitat in studies conducted overseas in similar habitat (Pham et al. 2014). Accordingly, it is highly likely that the trap/line sector will not reduce habitat structure and function to a point where there would be serious or irreversible harm.
CRITERIA: (ii) There is a strategy in place that is designed to ensure the UoA does not pose a risk of serious or irreversible harm to the habitats.
(a) Management strategy in place
| Trawl |
LOW RISK |
|
The main management measures used to limit potential habitat and ecosystem impacts from the fishery include spatial closures, the use of semi-pelagic trawl gear which flies slightly above the bottom, indirect effort restrictions through the TACC and limitations on the use of trawl apparatus through minimum holdings requirements. A management objective to minimise the effects of fishing on ecosystem components is included in the management framework for the fishery, together with associated trigger points and requirements to review fishing gear and operations if triggers are breached (DPIF, 2012a). These measures constitute at least a partial strategy which is expected to achieve the outcome reflected in criterion 2C(i).
In addition, a network of marine reserves has also been declared by the Australian Government off northern Australia, although supporting management plans are required to give the network practical effect.
| Trap/Line |
LOW RISK |
|
The main management measure in place for the trap/line sectors is the restriction on entry into the fishery and the number and design of trap gear, which previous studies have shown to have little impact on habitats. Given the relatively benign nature of the gear and the very limited spatial footprint of the fishery, these measures constitute at least a partial strategy which is expected to achieve the outcome reflected in criterion 2C(i).
(b) Management strategy implementation
| Trawl |
LOW RISK |
|
Spatial restrictions on the fishery, together with VMS/trawl track information demonstrating very limited gear coverage compared to the size of the fishery and the independent studies demonstrating the semi-demersal ‘Wendy’ type trawl gear used in the fishery has limited impact on benthic habitats (e.g. Moran and Stephenson, 2000), provide some objective basis for confidence that the partial strategy will work and measures are being implemented effectively.
| Trap/Line |
LOW RISK |
|
Compliance information demonstrating fishers comply with trap and line fishing gear restrictions together with research on similar style fish traps used in similar habitat showing limited impacts (Shester and Micheli, 2011), provide some objective basis for confidence that the partial strategy will work.
CRITERIA: (iii) Information is adequate to determine the risk posed to the habitat by the UoA and the effectiveness of the strategy to manage impacts on the habitat.
(a) Information quality
| Trawl |
MEDIUM RISK |
|
While there has been some characterisation of the habitat in the DF over several decades which has been compiled to support recent marine reserve planning (e.g. Australian Museum, 2005; DEWHA 2007) there are large offshore areas that remain unmapped. Accordingly, the habitats in the fishery are broadly known, but the nature, distribution and vulnerability of the main habitats may not be known at a level of detail relevant to the scale and intensity of the fishery. The fishery would be better placed against this indicator with a quantitative analysis of trawl position and coverage data in the context of the main habitat types encountered.
| Trap/Line |
LOW RISK |
|
Given the extremely limited footprint of the trap/line sectors, the existing information is probably sufficient to meet the low risk SG.
(a) Information and monitoring adequacy
| Trawl, Trap/Line |
LOW RISK |
|
Information is likely to be adequate to broadly understand the nature of the main impacts of gear use on the main habitats, including spatial overlap of habitat with fishing gear. The impacts of trawl and trap gear on similar habitats has been studied (e.g. Moran and Stephenson, 2000; Shester and Micheli, 2011), and VMS and logbook reporting provides good information on the spatial extent of interaction and the timing and location of the use of fishing gear.
PI SCORE – LOW RISK
2D: Ecosystems
CRITERIA: (i)The UoA does not cause serious or irreversible harm to the key elements of ecosystem structure and function.
(a) Ecosystem Status
| Trawl |
LOW RISK |
|
Serious or irreversible harm in the ecosystem context should be interpreted in relation to the capacity of the ecosystem to deliver ecosystem services (MSC, 2014). Examples include trophic cascades, severely truncated size composition of the ecological community, gross changes in species diversity of the ecological community, or changes in genetic diversity of species caused by selective fishing.
The overall impact of the trawl sector is limited through the TAC on species groupings, spatial closures, the use of comparatively selective trawl gear and the requirement for minimum holdings which restricts the number of vessels able to be used in the fishery. Given the large number of fish species that are likely to occupy a similar ecological niche as the target species, the healthy position of the main target stocks and the relatively minor impacts on other ecological components (e.g. ETP species, habitats) there is a reasonable argument that the fishery is highly unlikely to disrupt the key elements underlying ecosystem structure and function to a point where there would be a serious or irreversible harm. This is consistent with the qualitative ERA undertaken in 2009 which showed no high risks amongst assessed species (DRDPIFR, 2009).
| Trap/Line |
LOW RISK |
|
Trap/line gear is highly selective for target species, with limited impacts of ETP species and habitats. The main impact of the fishery is likely to come from the removal of the target and byproduct species from the ecosystem. Given the apparently low impact on non-retained species and the healthy position of target stocks, there is a reasonable argument that the fishery is highly unlikely to disrupt the key elements underlying ecosystem structure and function to a point where there would be a serious or irreversible harm. This is consistent with the qualitative ERA undertaken in 2009 which showed no high risks amongst assessed species (DRDPIFR, 2009).
CRITERIA: (ii) There are measures in place to ensure the UoA does not pose a risk of serious or irreversible harm to ecosystem structure and function.
(a) Management strategy in place
| Trawl |
LOW RISK |
|
The main management measures to limit the impact of the fishery on the wider ecosystem are:
- limits on overall catch through the TAC and species groupings;
- the use of minimum holdings which limit the number of trawl vessels in the fishery;
- the use of a semi-pelagic trawl which limits habitat impacts;
- area closures to limit the spatial extent of the fishery;
- restrictions on the number and design of fish traps;
- prohibitions on the retention of sharks and rays;
- monitoring and periodic stock assessment of target species; and
- monitoring of non-target species impacts through independent observers.
A management objective to minimise the effects of fishing on ecosystem components is included in the management framework for the fishery, together with associated trigger points and requirements to review fishing gear and operations if triggers are breached (DPIF, 2012a). These measures constitute at least a partial strategy which takes into account the available information and is expected to restrain the impacts of the UoAs on the ecosystem so as to achieve the outcomes reflected in criterion 2D(i).
| Trap/Line |
LOW RISK |
|
The measures in the trap/line sectors are similar to those in the trawl sector, albeit with gear specific restrictions. Given the highly targeted nature of the gear, these measures constitute at least a partial strategy which takes into account the available information and is expected to restrain the impacts of the UoAs on the ecosystem so as to achieve the outcomes reflected in criterion 2D(i).
(b) Management strategy implementation
| Trawl, Trap/Line |
LOW RISK |
|
While there have been no dedicated studies of the trophic impacts of target species harvesting in the DF, stock assessments demonstrating healthy stock status for the target species (NTG, 2017), observer information demonstrating limited interactions with ETP species (NTG, 2017), spatial information demonstrating a limited footprint for both sectors, and independent research demonstrating limited impacts from the gear used (e.g. Moran and Stephenson, 2000), provides some objective basis for confidence that the partial strategy will work and is being implemented successfully.
CRITERIA: (iii) There is adequate knowledge of the impacts of the UoA on the ecosystem.
| (a) Information quality |
LOW RISK |
|
The structure and function of the main elements of the northern Australian ecosystem has been relatively well studied, with much of the information compiled to support marine reserve planning processes (e.g. NOO, 2004; Australian Museum, 2005; DEWHA, 2007; 2008a; 2008b) or fisheries management (e.g. Bustamante et al, 2010). This is likely to be sufficient to broadly understand the key elements of the ecosystem. Continuing monitoring programs collect data (catch, species composition, effort, fishing location, bycatch composition and volume) that are likely to be capable of detecting any increase in risk level. Information is sufficient to support the development of strategies to manage ecosystem impacts.
| (b) Investigations of UoA impacts |
MEDIUM RISK |
|
It is likely that the main impacts of the fishery can be inferred from existing information from studies on similar fisheries (e.g. Moran and Stephenson, 2000; Shester and Micheli 2011), however we are not aware of any studies specifically investigating the ecosystem impacts of this fishery. This score could be improved through spatial analysis of fishing footprints on individual habitat types and ecosystem modelling of the food webs in the area of the fishery.
PI SCORE – LOW RISK
COMPONENT 3: Management system
3A: Governance and Policy
CRITERIA: (i) The management system exists within an appropriate and effective legal and/or customary framework which ensures that it:
- Is capable of delivering sustainability in the UoA(s)
- Observes the legal rights created explicitly or established by custom of people dependent on fishing for food or livelihood
| (a) Compatibility of laws or standards with effective management |
LOW RISK |
|
The NTDF operates in designated waters off the Northern Territory, Australia. Under an Offshore Constitutional Settlement (OCS) with the Commonwealth of Australia, the fishery is managed by the Northern Territory Fisheries Joint Authority (NTFJA). The NTFJA comprises representatives from Australian Commonwealth and Northern Territory Governments and provides for the Australian and NT governments to jointly manage the fishery given the possibility of shared resources with adjacent national and international jurisdictions. Day-to-day management is undertaken by the Northern Territory Department of Primary Industries and Fisheries (DPIF) on behalf of the NTFJA. High level objectives for fisheries managed by DPIF are set out in the Northern Territory Fisheries Act 1988.
The Northern Territory/NTFJA management and legislative framework is consistent with local, national or international laws or standards that are aimed at achieving sustainable fisheries in accordance with Components 1 and 2.
| (b) Respect for Rights |
LOW RISK |
|
Customary rights of Aboriginal people are recognised in the Northern Territory. The Blue Mud Bay agreement has resulted in waters overlying aboriginal land to the low tide mark having access controlled by the aboriginal communities in that area. Customary harvest by traditional means has no limitations in the NT Fisheries Act. The rights of customary fishers are recognised by the s53 exemption which provides that: Unless and to the extent to which it is expressed to do so but without derogating from any other law in force in the Territory, nothing in a provision of this Act or an instrument of a judicial or administrative character made under it shall limit the right of Aboriginals who have traditionally used the resources of an area of land or water in a traditional manner from continuing to use those resources in that area in that manner. Additional customary rights may be sought under Commonwealth Native Title legislation.
CRITERIA: (ii) The management system has effective consultation processes that are open to interested and affected parties. The roles and responsibilities of organisations and individuals who are involved in the management process are clear and understood by all relevant parties.
| (a) Roles and Responsibilities |
LOW RISK |
|
The roles and responsibilities of the main people (e.g. Fisheries Minister, Director of Fisheries) and organisations (AFANT, NTSC, NLC and eNGOs) involved in the Northern Territory fisheries management process are well-understood, with relationships and key powers explicitly defined in legislation.
| (b) Consultation Process |
LOW RISK |
|
Consultation on management arrangements is primarily undertaken through the Offshore Snapper Advisory Group (OSAG), comprising members from industry, recreational and FTO representatives, compliance and departmental officers. OSAG was established in 2010 to develop a comprehensive policy and management framework incorporating a mechanism to better utilise the red snapper resources. Given the small number of operators in the fishery, ad hoc consultation in relation to commercial sector arrangements is also undertaken directly with licence holders. Formal consultation is also undertaken through the Northern Territory Seafood Council (NTSC) and the Demersal Fishermen’s Association. NT Fisheries also produces publications, such as Fishery Reports, Fishnotes and newsletters, to inform stakeholders (e.g. NTG 2016). Where significant management changes are proposed, public consultation documents are developed (e.g. the proposed management arrangements document to support the new quota system).
CRITERIA: (iii) The management policy has clear long-term objectives to guide decision making that are consistent with the outcomes expressed by Components 1 and 2, and incorporates the precautionary approach.
| (a) Objectives |
LOW RISK |
|
The overarching objectives for the management of the Northern Territory’s fisheries set out in Section 2A of the Fisheries Act 1988. These are:
(a) to manage the aquatic resources of the Territory in accordance with the principles of ecologically sustainable development; and
(ab) to protect the environment, people and economy of the Territory from the introduction and spread of aquatic noxious species and diseases; and
(b) to maintain a stewardship of aquatic resources that promotes fairness, equity and access to aquatic resources by all stakeholder groups, including
(i) indigenous people; and
(ii) the commercial fishing, aquaculture and fishing tourism industries; and
(iii) amateur fishers; and
(iv) others with an interest in the aquatic resources of the Territory; and
(c) to promote the optimum utilisation of aquatic resources to the benefit of the community.
The definition of ecologically sustainable development (ESD) in the Act is consistent with Australia’s National Strategy for Ecologically Sustainable Development (1992) which explicitly endorses a precautionary approach (Anon, 1992).
Accordingly, clear long term objectives that guide decision making, consistent with Components 1 and 2, are explicit within the management system.
PI SCORE – LOW RISK
3B: Fishery Specific Management System
CRITERIA: (i) The fishery specific management system has clear, specific objectives designed to achieve the outcomes expressed by Components 1 and 2.
| (a) Objectives |
LOW RISK |
|
Fishery specific objectives are outlined in the “Management Arrangements” document (DPIF, 2012a), and are explicit within the fishery’s management system. These objectives are consistent with Components 1 and 2, although it is not explicit whether they are short or long term (or both). Many of the indicators are measurable (e.g. maintain grouped species catch within 32% of total annual catch) while others are relatively generic (e.g. minimise effects of fishing on the ecosystem) and not easily quantified. The fishery would benefit from more explicitly defining the short and long term objectives of the fishery.
CRITERIA: (ii) The fishery specific management system includes effective decision making processes that result in measures and strategies to achieve the objectives and has an appropriate approach to actual disputes in the fishery.
| (a) Decision making |
LOW RISK |
|
The NTFJA and DPIF fisheries decision-making process is well established. The NTFJA has ultimate responsibility for the management of the fishery, and is empowered to make decisions in relation to the fishery, to be implemented by DPIF under the NT Fisheries Act 1988. The NTFJA is advised by DPIF who, in turn, seek input from stakeholders and technical experts.
The decision making process appears to respond to serious or other important issues in a timely and transparent manner. The introduction of the new quota management arrangements is an example of the decision making process responding to issues raised through fishery consultative processes. The establishment of a framework of decision rules which trigger management responses provides a structured process to respond to research and monitoring outcomes.
|
(b) Use of the Precautionary approach |
MEDIUM RISK |
The use of the precautionary approach is implicit in the Fisheries Act objective to manage fisheries in accordance with the principles of ESD. Similarly, available evidence indicates that the development of the DF has been precautionary to date, with the issuance of only four finfish trawl licences and fishery decisions appear to be made based on the best available information. Nevertheless, the main uncertainty appears to be the extent to which the combined TACCs for the DF and TRF for the main target species reflect the productive capacity of the stocks. Accordingly, it is not clear a precautionary approach has been taken in all cases.
| (c) Accountability and Transparency |
LOW RISK |
|
Information on the biological, ecological, economic and social performance of the fishery is reported annually through the Department’s Stock Status Reports (e.g. NTG, 2016a; 2017). Explanations on management decisions appear to be made to stakeholders on a timely basis. Annual Reports of the NTFJA are available on the AFMA website, including records of decisions made and background information papers[1]. Consultation papers were developed to support the introduction of the new quota system which provided explanations of the main issues. Given the relatively small number of operators in the fishery, consultation on trigger points and management actions are undertaken directly.
[1] http://www.afma.gov.au/fisheries/joint-authority-fisheries/
CRITERIA: (iii) Monitoring, control and surveillance mechanisms ensure the management measures in the fishery are enforced and complied with.
| (a) MCS Implementation |
LOW RISK |
|
The MCS system in the fishery primarily comprises commercial logbooks, quota monitoring through the compulsory notices and records, land-based fisheries inspections primarily by AFMA, annual observer coverage, satellite tracking of vessel location through VMS, clear sanctions set out in legislation enforceable through the courts and promotion of voluntary compliance through education. A formal compliance risk assessment has reportedly been carried out of the fishery and showed no major compliance risks (NTG, 2012). There have been few reported problems with compliance in the CLF and there is no evidence of systematic non-compliance (NTG, 2017).
| (b) Sanctions and Compliance |
LOW RISK |
|
An effective framework of sanctions is established by the Fisheries Act and Regulations. Part 4, Division 2 of the Act sets out broad powers of Fisheries Officers, while Division 4 establishes a framework of offences with sanctions consistent with the severity of the offence. Part 4, Division 4A of the Act allows for infringement notices applying a monetary penalty to be issued for prescribed offences. No systematic non-compliance is thought to exist (NTG, 2017) and fishers have provided (and funded) information of relevance to the management of the fishery (NTFJA, 2016).
CRITERIA: (iv) There is a system for monitoring and evaluating the performance of the fishery specific management system against its objectives.
There is effective and timely review of the fishery specific management system.
| (a) Evaluation coverage |
LOW RISK |
|
Performance of the management system is monitored through the decision rules framework in the “Management Arrangements” document (DPIF, 2012a). The decision rules set out operational objectives, performance indicators, trigger points and management actions across the main elements of the management systems: target species, byproduct species, bycatch species, ETP species and ecosystems. Most of these indicators are measurable using existing information (e.g. increases/decreases in catch composition), while others appear more qualitative (e.g. “industry, scientists, SEWPAC or managers are satisfied with operations”). Performance is reported annually through the Fishery Status reports process (e.g. NTG, 2017). The effectiveness of the compliance regime is evaluated through periodic risk assessments.
| (b) Internal and/or external review |
LOW RISK |
|
Performance against the decision rules framework is subject to annual internal review. The fishery is also periodically assessed externally by the Commonwealth Department of Environment and Energy under the Environment Protection and Biodiversity Conservation Act 1999. Assessments to date have been at intervals of 5 years on the basis that products from the fishery have been added to the List of Exempt Native Specimens (LENS).
PI SCORE – LOW RISK
Acknowledgements
This seafood risk assessment procedure was originally developed for Coles Supermarkets Australia by MRAG Asia Pacific. FRDC is grateful for Coles’ permission to use its Responsibly Sourced Seafood Framework.
It uses elements from the GSSI benchmarked MSC Fishery Standard version 2.0, but is neither a duplicate of it nor a substitute for it. The methodology used to apply the framework differs substantially from an MSC Certification. Consequently, any claim about the rating of the fishery based on this assessment should not make any reference to the MSC.