
Assessment Summary
|
Commonwealth Trawl Sector |
Units of Assessment: |
|
|
Product Names: |
Blue Grenadier, Blue-eye Trevalla, Orange Roughy (Cascade, Eastern Zone), Pink ling (eastern, western), Gemfish (eastern, western) |
|
|
Species: |
Blue Grenadier Macruronus novaezelandiae (Hector 1871) (37 227 001) Blue-eye Trevalla Hyperoglyphe antarctica (37 445 001) Orange Roughy Hoplostethus atlanticus (37 255 009) Pink ling Genypterus blacodes (Forster, 1801) (37 228 002) Gemfish Rexea solandri (37 439 002) |
|
|
Stocks: |
Blue Grenadier – South eastern stock Blue-eye Trevalla – Eastern stock Orange Roughy – Cascade stock and Eastern Zone stock |
|
|
Gear types: |
Otter Trawl |
|
|
Year of Assessment: |
2017 |
|
|
Performance Indicator |
Blue Grenadier |
Blue Eye Trevalla |
Orange Roughy – Cascade |
Orange Roughy – Eastern |
Pink Ling – Eastern |
Pink Ling – Western |
Gemfish – Eastern |
Gemfish – Western |
|
COMPONENT 1 |
|
|
|
|
|
|
|
|
|
1A: Stock Status |
LOW |
MEDIUM |
LOW |
MEDIUM |
MEDIUM |
LOW |
HIGH |
LOW |
|
1B: Harvest Strategy |
LOW |
LOW |
LOW |
LOW |
LOW |
LOW |
PHR |
MEDIUM |
|
1C: Information and Assessment |
LOW |
LOW |
LOW |
LOW |
LOW |
LOW |
LOW |
LOW |
|
COMPONENT 2 |
|
|
|
|
|
|
|
|
|
LOW |
LOW |
LOW |
LOW |
LOW |
LOW |
LOW |
LOW |
|
|
2B: ETP Species |
PHR |
PHR |
MEDIUM |
MEDIUM |
PHR |
MEDIUM |
MEDIUM |
MEDIUM |
|
2C: Habitats |
LOW |
LOW |
LOW |
LOW |
LOW |
LOW |
LOW |
LOW |
|
2D: Ecosystems |
LOW |
LOW |
LOW |
LOW |
LOW |
LOW |
LOW |
LOW |
|
COMPONENT 3 |
|
|
|
|
|
|
|
|
|
3A: Governance and Policy |
LOW |
LOW |
LOW |
LOW |
LOW |
LOW |
LOW |
LOW |
|
3B: Fishery-spec. Man. System |
LOW |
LOW |
LOW |
LOW |
LOW |
LOW |
LOW |
LOW |
- Most of the main stocks are well-positioned against P1 performance indicators, except for Eastern gemfish where, despite recent years of low total catch, predicted recovery has not yet occurred.
- The fishery appears relatively well-placed against most of the P2 performance indicators, although there is uncertainty about whether existing arrangements are sufficient to ensure stock rebuilding for blue warehou and eastern gemfish.
- The fishery is well-positioned against P3 performance indicators.
Outlook
Blue Grenadier
|
Component |
Outlook |
Comments |
|
Stable |
The most recent stock assessment (2013) predicted spawning biomass to remain well above the target reference point. |
|
|
Bycatch and ecosystems |
Stable |
The main Component 2 issue for the CTS has been the absence of recovery in the eastern gemfish stock. A rebuilding plan has been developed to encourage recovery although there is limited evidence of recovery to date. |
|
Stable |
No major changes are expected to Component 3 PIs |
Blue Eye Trevalla
|
Component |
Outlook |
Comments |
|
Improving |
A 2015 revised Tier 4 stock assessment has produced a more optimistic assessment of stock status. Catches have been below Recommended Biological Catch (RBC) in recent years which should lead to stock growth towards the target reference point. |
|
|
Bycatch and ecosystems |
Stable |
The main Component 2 issue for the CTS has been the absence of recovery in the eastern gemfish stock. A rebuilding plan has been developed to encourage recovery although there is limited evidence of recovery to date. |
|
Stable |
No major changes are expected to Component 3 PIs |
Orange Roughy – Cascade stock
|
Component |
Outlook |
Comments |
|
Stable |
Spawning biomass estimates prior to 2009 were well above target levels and catches have been well below the RBC in all but one year (2009) since then. |
|
|
Bycatch and ecosystems |
Stable |
No major changes are expected to Component 2 PIs |
|
Stable |
No major changes are expected to Component 3 PIs |
Orange Roughy – Eastern stock
|
Component |
Outlook |
Comments |
|
Improving |
The most recent assessments suggest the stock trajectory is increasing, with the stock now above the limit reference point after a long period of being classified as overfished. Recovery should continue under conservative catch limits. |
|
|
Bycatch and ecosystems |
Stable |
No major changes are expected to Component 2 PIs |
|
Stable |
No major changes are expected to Component 3 PIs |
Pink Ling – Eastern stock
|
Component |
Outlook |
Comments |
|
Improving |
Stock assessments show the trajectory of the stock improving. Recent catches have been below levels that are projected to result in the stock rebuilding to target levels by 2023. |
|
|
Bycatch and ecosystems |
Stable |
The main Component 2 issue for the CTS has been the absence of recovery in the eastern gemfish stock. A rebuilding plan has been developed to encourage recovery although there is limited evidence of recovery to date. |
|
Stable |
No major changes are expected to Component 3 PIs |
Pink Ling – Western stock
|
Component |
Outlook |
Comments |
|
Stable |
Stock assessments show the western pink ling stock is above the target, with catches well below western RBC levels. |
|
|
Bycatch and ecosystems |
Stable |
No major changes are expected to Component 2 PIs |
|
Stable |
No major changes are expected to Component 3 PIs |
Gemfish – Eastern
|
Component |
Outlook |
Comments |
|
Uncertain |
Stock projections suggest the stock should rebuild to the limit reference point by 2027, although recruitment levels have been below average in recent years and there is limited evidence of recovery to date. |
|
|
Bycatch and ecosystems |
Stable |
No major changes are expected to Component 2 PIs |
|
Stable |
No major changes are expected to Component 3 PIs |
Gemfish – Western
|
Component |
Outlook |
Comments |
|
Stable |
There are uncertainties around the Tier 1 and Tier 4 assessments for this stock, although catches have been stable in recent years and are low as a proportion of the RBC and below the Great Australian Bight catch trigger. It is possible risk scores may lower with updated assessments addressing uncertainties identified by GABRAG. |
|
|
Bycatch and ecosystems |
Stable |
No major changes are expected to Component 2 PIs |
|
Stable |
No major changes are expected to Component 3 PIs |
This summary has been adapted from Georgeson et al (2016):
The Commonwealth Trawl Sector (CTS) of the Southern and Eastern Scalefish and Shark Fishery (SESSF) stretches from Sydney southwards around Tasmania to Cape Jervis in South Australia, where it abuts the Great Australian Bight Trawl Sector (GABTS; Figure 1). The CTS and GHTS are major domestic sources of fresh scalefish for the Sydney and Melbourne markets, and there is minimal international export from these fisheries.
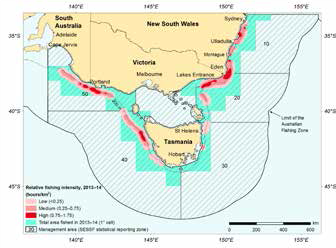
Figure 1: Relative fishing intensity in the CTS in the 2013-4 fishing season.
The SESSF is a multisector, multigear and multispecies fishery, targeting a variety of fish and shark stocks using different gear types in different areas or depth ranges. Effort in the SESSF is distributed across all fishery areas, but since about 2005 has become increasingly concentrated on the shelf rather than in slope or deeper waters. The CTS predominantly uses otter trawl and Danish-seine methods. Pair trawling and midwater trawling methods are also permitted under the SESSF management plan.
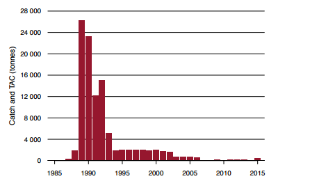
In 2015–16, trawlers reported around 54,078 hours of fishing effort, representing a decrease from the 55,172 hours in 2014–15 (Figure 2). The number of active trawlers increased slightly from 35 in 2014–15 to 38 in 2015–16. The total landings of all species managed under TACs from the CTS in 2015–16 were 8 057 t. Flathead, blue grenadier, pink ling, eastern school whiting and orange roughy (eastern zone) accounted for approximately 79 per cent of the catch.
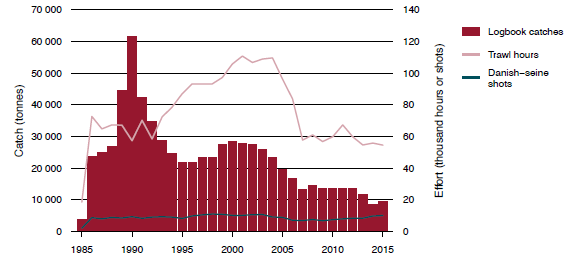
Figure 2: Total catch and fishing effort in the CTS, 1985 to 2015. Source: Georgeson et al. (2016).
COMPONENT 1: Target species
|
1A: Stock Status |
||||||
|
CRITERIA: (i)The stock is at a level which maintains high productivity and has a low probability of recruitment overfishing. |
||||||
|
(a) Stock Status |
||||||
|
Blue grenadier |
LOW RISK |
|||||
|
Comparative analysis of otolith chemistry and shape indicates two separate biological stocks of Blue Grenadier: one in the region of the Great Australian Bight Trawl Sector (Commonwealth) and the other in the region of the Commonwealth Trawl Sector (Georgeson et al, 2016). This assessment focuses on the stock in the CTS. The Blue Grenadier fishery can be divided into two sub-fisheries (‘spawning’ and ‘non-spawning’). The ‘spawning’ sub-fishery is based in winter off western Tasmania and is only fished between June and September each year, while the ‘non-spawning’ sub-fishery operates all year and targets immature fish throughout the fishery range. Georgeson et al (2016) reported that “the tier 1 integrated stock assessment was updated in 2013 (Tuck 2013), incorporating data to the end of 2012, as well as estimates of spawning biomass from industry-based acoustic surveys (2003 to 2010) and egg survey estimates of female spawning biomass (1994 to 1995). Results for the base-case model concluded that the spawning biomass in 2012 was around 77 per cent of the unexploited spawning stock biomass (SB0) and in 2014 was forecast to be approximately 94 per cent of SB0 (Tuck 2013).” On this basis, the stock is highly likely to be above the PRI and fishing mortality is at a level consistent with MSY. |
||||||
|
Blue eye trevalla |
MEDIUM RISK |
|||||
|
A single biological stock of blue-eye trevalla is assumed for Australian waters, separate from the New Zealand stock(s). However, the Australian stock is managed as two units, east and west, due to differences in CPUE trends (Georgeson et al, 2016). The Commonwealth landed catch of blue-eye trevalla in the 2015–16 fishing season was 298 t, with 6% landed by the CTS (Georgeson et al 2016). Blue-eye trevalla is assessed as a tier 4 stock under the SESSF HSF, with the assessment based on catch and-effort data for the auto-longline and dropline fisheries. The 2013 tier 4 assessment (Haddon 2013) estimated that the four-year average standardised CPUE was slightly below target levels in the west, and near the limit levels in the east. The 2015 tier 4 assessment (Haddon 2015) used the revised catch per-hook series in the CPUE analyses. The assessment estimated 4-year average CPUE for the combined east and west components to be between the limit and the target. The primary measures to determine stock status are the information provided by the 2015 tier 4 assessment and recent catch (Georgeson et al 2016). The 2015 assessment indicated that the previously reported decline in CPUE in the east was inflated by the use of catch-per-day rather than catch-per-hook data records. The RBC estimate from the 2015 assessment was precautionary because it did not account for the impact of closures and the influence of orca depredation on catch rates and fisher behaviour. Thus the stock was classified as not overfished because the index of abundance was between the limit and the target reference points. Georgeson et al (2016) report that the 2016–17 RBC is a more useful indicator of the sustainable catch level than the RBC estimate produced by the 2013 tier 4 assessment. Considering fishing mortality in the 2015–16 fishing season against the 335 t TAC and in the context of the updated 2016–17 RBC of 444 t produced by the 2015 tier 4 assessment, the stock was classified as not subject to overfishing. Based on the above, is it likely that the stock is above PRI. However, there is only limited evidence to date that the stock is fluctuating at or around MSY, and therefore does not meet the second condition of the low risk SG. Accordingly, the stock scores medium risk. Nevertheless, the more recent Tier 4 analysis has produced a more optimistic assessment of stock status with the most recent point in the CPUE time series being above the target reference point. If this trend continues, the stock would likely be scored low risk in future assessments. |
||||||
|
Orange roughy – Cascade Plateau |
LOW RISK |
|||||
|
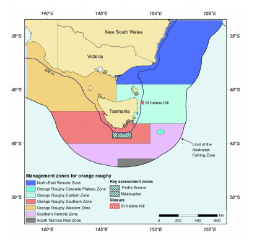
A genetic study by Gonçalves da Silva et al. (2012) concluded that orange roughy within the Australian Fishing Zone form a single genetic stock, but identified some differentiation between Albany/Esperance, Hamburger Hill (in the Great Australian Bight) and south-eastern Australia. However, as residency or slow migration may result in separate demographic units despite genetic similarity (Morison et al. 2013), the Australian orange rough fishery is managed and assessed as a number of discrete regional management units.
Figure 3: (a) Management zones for orange roughy in the SESSF; (b) orange roughy catch, Cascade Plateau between 1989 and 2015 (Source: Georgeson et al, 2016) The Cascade Plateau shows a different catch history to all other orange roughies fisheries, and is considered the only fishery not to have been depleted (Georgeson et al 2016). Georgeson et al (2016) report that spawning aggregations of Cascade Plateau orange roughy were assessed using acoustic survey abundance indices between 2003 and 2009. These assessments rely on the single largest acoustic estimate of biomass each year because spawning aggregations on the Cascade Plateau are highly variable and have shown no discernible trends in volume or estimated biomass over time (Morison et al. 2013). No formal stock assessment has been undertaken since 2009 due to a lack of effort and thus new data for the fishery. The projections from the 2009 model predicted that, if the 315 t long-term RBC was fully caught by 2011, the spawning biomass of the stock would be at 0.64SB0 in 2011 (Morison et al. 2012). Catches since 2007 have been low and it is considered that environmental factors limit the formation of spawning aggregations. Given that spawning biomass estimates prior to 2009 were well above target levels and catches have been well below the RBC in all but one year (2009), there is good evidence that the western stock is highly likely to be above PRI and above levels consistent with MSY. |
||||||
|
Orange roughy – Eastern zone |
MEDIUM RISK |
|||||
|
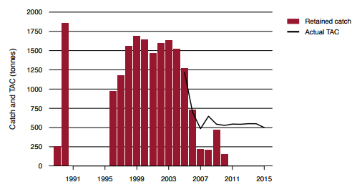
Georgeson et al (2016) report that the eastern zone was declared overfished in 2006, with catch limited to incidental catch allowances only. Most of the historical fishing grounds for orange roughy deeper than 700 m were also closed to trawling in January 2007 (AFMA 2006). Targeted fishing for orange roughy in the eastern zone recommenced in the 2015–16 fishing season, with 436 t landed.
Figure 4: orange roughy catch, Eastern zone between 1989 and 2015 (Source: Georgeson et al, 2016) The 2006 assessment for the eastern zone (Wayte 2006) estimated that spawning stock biomass had declined to 10 per cent of unfished levels (0.1SB0), following the large catches taken in the late 1980s and early 1990s. Compensatory increases in the biological productivity of this stock, including age at maturity, length standardised fecundity, and the proportion of the population spawning, appear to have occurred as a density-dependent response to the substantial decline in orange roughy abundance during the 1990s. As a result, the reproductive potential of the stock in 2010 was estimated to be 32 per cent of that at unfished levels, despite the greatly reduced biomass (Kloser et al. 2011). Results of acoustic surveys in 2010 provided evidence of stock rebuilding (SlopeRAG 2013b). Using new catch, acoustic and age-composition data, the 2011 assessment was updated in 2014. It predicted the 2015 female spawning biomass (SB2015/SB0) to be at 26 per cent, with a predicted unfished female spawning biomass of 38,727 t (Upston et al. 2014). The assessment was accepted by SlopeResource Assessment Group (SlopeRAG). As part of the assessment, MCMC analysis was undertaken to examine variability amongst models. The median estimate of female spawning depletion (SB2015/SB0) was 0.25 with a 95% Bayesian CI of 0.23 to 0.28. While it was noted that the narrow confidence intervals may indicate that the model is constrained, this is considered sufficient evidence to suggest that there is a high likelihood that the biomass is above PRI. However, the mean and median estimates suggest that the fishery is unlikely to be at or fluctuating around BMSY, and as such the stock is assessed as medium risk. |
||||||
|
Pink ling – Eastern stock |
MEDIUM RISK |
|||||
|
Although genetic variation between eastern and western pink ling has not been found (Ward et al. 2001), differences in catch-rate trends, and size and age (Morison et al. 2013), indicate that there are either two separate stocks, or that exchange between eastern and western components of the pink ling stock is low. Thus they are managed as separate stocks. Although total catches of pink ling are managed under a single TAC,AFMA has management arrangements in place to constrain catches of the eastern stock to the eastern catch limit, Pink ling has been assessed using quantitative, model-based (tier 1) stock assessments since 2003. Although a number of versions of the model have been developed by different authors, SlopeRAG agreed to use a model developed by Cordue (Cordue, 2013) as the base-case model for providing advice (Georgeson et al, 2016). The Cordue (2013) assessment was most recently updated in 2015 (Cordue 2015). The updated assessment estimated the eastern stock biomass in 2015 to be 0.30 B0. Thus, for the eastern stock there is evidence that the stock is highly likely to be above PRI, but limited evidence that the stock is at levels consistent with MSY.
Figure 5: Estimated spawning stock biomass for eastern pink ling, 1970 to 2015 (Source Cordue 2015). |
||||||
|
Pink ling – Western stock |
LOW RISK |
|||||
|
The updated assessment (Cordue 2015) estimated the western stock biomass in 2015 to be 0.72 B0. Accordingly, there is good evidence that the western stock is highly likely to be above PRI and also above levels consistent with MSY.
Figure 6: Estimated spawning stock biomass for western pink ling, 1970 to 2015 (Source Cordue 2015). |
||||||
|
Gemfish – Eastern stock |
HIGH RISK |
|||||
|
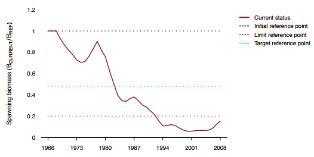
Georgeson et al (2016) report that there are two distinct stocks of gemfish in Australia, an eastern and western stock, separated by a boundary at the western end of Bass Strait (Colgan & Paxton 1997; Moore et al. 2016). Catch of gemfish in the Eastern zone peaked at more than 6,000 t in 1978, and declined rapidly after 1987. The Eastern zone catch in 2015/16 was around 30 t. An integrated stock assessment model for eastern gemfish was first developed in 2008 and was last updated in 2010 with data on catch and length frequency up to 2009 (Georgeson et al 2016). The estimates of spawning stock biomass did not differ greatly among years, with the base-case model estimating that the spawning stock biomass in 2009 was 15.6 per cent of the 1968 level. While the model has not been updated since 2010 due to a paucity of useful additional datasets, it has been regularly re-run using updates of the original data sources. While Georgeson et al. (2016) state that catches have been historically low in recent years, there have been no public data published since 2014 on total catch plus discards and there are no data to suggest recovery of the stock. On this basis, it is considered that the stock remains overfished.
Figure 7: Estimated spawning stock biomass of gemfish, eastern zone 1966 to 2008 (Source: Georgeson et al, 2016) |
||||||
|
Gemfish – Western stock |
LOW RISK |
|||||
|
A total of 76 t of western gemfish was landed by the CTS and 5 t by the Southern and Eastern Shark and Scalefish Fishery (Gillnet, Hook and Trap Sector) (SESSF (GHTS)) in 2015–16 (Georgeson et al 2016). Historically, a substantial catch of western gemfish was taken within the GABTS, however in 2015–16 catch had decreased to a historical low of 3 t due to a cessation of targeting rather than declines in abundance (Georgeson et al 2016). Georgeson et al (2016) report that an integrated stock assessment model (tier 1) was developed for western gemfish in the CTS and the GABTS in 2011, and was repeated in 2012 and 2013 (Chambers et al. 2014). Updates included additional catch data, and revised age and length data. Western Tasmanian catches were excluded from the assessment because they were likely to be from the eastern gemfish stock. The most recent updated assessment gave a spawning biomass estimate of 74 per cent of unfished biomass in 2013 (0.74 SB0), compared with the 2010 estimate of 0.69 SB0. Accordingly, there is good evidence that the western stock is highly likely to be above PRI and above levels consistent with MSY.
|
||||||
|
PI SCORE |
LOW RISK – Blue grenadier, Orange roughy – Cascade, Pink ling –Western, Gemfish – Western |
|||||
|
MEDIUM RISK – Blue eye trevalla, Orange roughy – eastern, Pink ling – Eastern |
||||||
|
HIGH RISK – Gemfish – Eastern |
||||||


|
1B: Harvest Strategy |
|||
|
CRITERIA: (i)There is a robust and precautionary harvest strategy in place. |
|||
|
(a) Harvest Strategy |
|
||
|
The CTS harvest strategy consists of:
A harvest strategy (HS) framework has been in place in the SESSF since 2005. The most recent version of SESSF Harvest Strategy was agreed in 2015 (AFMA, 2015a). The SESSF HS is designed to meet the objectives of the Commonwealth Fisheries Harvest Strategy Policy 2007 (HSP), namely “the sustainable and profitable use of Australia’s Commonwealth fisheries in perpetuity through the implementation of harvest strategies that maintain key commercial stocks at ecologically sustainable levels, and within this context, maximise the economic returns to the Australian community” (DAFF, 2007). To meet this objective, harvest strategies are designed to pursue an exploitation rate that keeps fish stocks at a level required to produce maximum economic yield (MEY) and ensure stocks remain above a limit biomass level (BLIM) at least 90% of the time. Alternative reference points may be adopted for some stocks to better pursue the objective of maximising economic returns across the fishery as a whole (AFMA, 2015a). The following summary of the HSF structure and processes is adapted from AFMA (2015a): The HSF uses a three tier approach designed to apply different types of assessments and cater for different amount of data available for different stocks. The HSF adopts increased levels of precaution that correspond to increasing levels of uncertainty about stock status, in order to reduce the level of risk associated with uncertainty. Tier 1 represents the highest quality of information available (i.e. a robust integrated quantitative stock assessment). Each Tier has its own harvest control rule (HCR) that is used to determine a recommended biological catch (RBC). The RBCs provide the best scientific advice on what the total fishing mortality (landings from all sectors plus discards) should be for each species/stock. For all Tier levels, once the RBC is determined from the results of the assessment and the application of the relevant HCR, a recommended total allowable catch (TAC) is calculated based on the TAC setting rules. For Tier 1, the HCR is based on the following reference points:
The Tier 1 harvest control rule applies to species and/or stocks where there is a robust quantitative assessment that provides estimates of current biomass levels, and where estimates or appropriate proxies are available for BLIM, BTARG and FTARG. Tier 3 and Tier 4 assessments use other indicators (relating to fishing mortality and catch rates respectively) and reference points which are taken as proxies for the biomass reference points for Tier 1. A Tier 3 stock assessment uses information available on the age structure of annual catches and annual total catch weight, as well as knowledge of basic biological parameters, e.g. natural mortality, length at age, weight at length, the stock recruitment relationship steepness, fecundity at age and selectivity at age. The catch control rule uses the ratio of the target exploitation rate to the actual exploitation rate as a multiplier on the current average catch to determine the RBC. The Tier 4 assessment is based entirely on catch and CPUE. The Tier 4 analysis determines an RBC by selecting CPUE reference points that are taken as proxies for the estimated BLIM and BTARG. This is done by assuming that the CPUE is proportional to stock abundance, an assumption that is made in most SESSF assessments. The status of fish stocks in the SESSF, and how they are tracking against the HSF, is reported to the RAGs, MACs and AFMA Commission as part of the yearly TAC Setting process. The data used for input into the stock assessment process are collected by the ISMP, AFMA logbooks and CDRs and FISs. Otoliths from the biological sampling are provided to a private contractor for ageing. All sampling and age data are provided to stock assessment scientists for analysis or reporting. The analyses are then discussed by RAGs, which produce final stock assessment reports for quota species in the SESSF during October and November each year. The stock assessment reports provide recommended biological catch (RBC) amounts for each quota species. Other sources of mortality arising from discarded catch, catch taken by other jurisdictions (e.g. State and recreational sectors) or research catch allowance, are subtracted from the RBC to produce a Commonwealth TAC. Each stock is assessed under the appropriate Tier level as advised by the RAGs and SESSFRAG. In mid-December, AFMA produces a position paper with recommended TACs for quota species for the upcoming fishing season, based on the stock assessments and RAG advice. The paper is distributed to interested parties and undergoes a public comment period. In early February, a South East Management Advisory Committee (SEMAC) TAC Setting meeting is held where TAC recommendations are made. The outcomes of RAGs and SEMAC together with the AFMA position paper and any public comments received, are then sent to the AFMA Commission to determine TACs for the upcoming fishing season in mid-February. |
|||
|
Blue grenadier |
LOW RISK |
||
|
Blue Grenadier is a Tier 1 stock under the HSF. Georgeson et al (2016) reported that “Blue grenadier was subject to multiyear TACs of 4 700 t for the 2009–10 to 2011–12 seasons, and 5 208 t for the 2012–13 and 2013–14 seasons. The 2013 assessment estimated a substantially increased three-year RBC of 8 810 t, starting in 2014–15. A 2014–15 TAC of 6 800 t was implemented, after consideration of industry’s preference for a cautious approach to increasing the TAC, to promote economic stability (SEMAC 2014). The multiyear TAC increased to 8796 t in the 2015–16 season. Reported landings in 2015–16 were 1754 t.” Based on the above, the harvest strategy is responsive to the state of the stock and all of the elements work together towards achieving the stock management objectives reflected in Criterion 1A (i). |
|||
|
Blue eye trevalla |
LOW RISK |
||
|
Blue-eye trevalla is classified as a Tier 4 species, using catch and-effort data for the auto-longline and dropline fisheries. Stock status determinations for blue-eye trevalla and the setting of RBCs has been influenced historically by considerable uncertainty in the CPUE time series (e.g. based on changes in fishing gear, orca depredation; Slope RAG, 2015). The AFMA Commission had previously agreed to implement a phased TAC reduction over three years (335 t for the 2014–15 season, 282 t for 2015–16 and 229 t for 2016–17), based on an RBC of 269 t. However, in 2015 the Commission agreed to pause the step down TAC, noting that additional work had been contracted on CPUE (SlopeRAG, 2015). The additional analyses were completed in 2015 on the CPUE time series which led to an increase in the RBC to 444 t (SEMAC, 2016). SlopeRAG recommended, and the AFMA Commission approved, a TAC for 2016-7 set for one year at 410 t. Notwithstanding historical uncertainties in CPUE time series, the close monitoring of trends in the fishery under the SESSF HSF, the tools in place to effect changes in fishing mortality (TAC, ITQs, HCR), and adjustments to the TAC according to well-defined HCRs and the new CPUE analyses which appear to provide a more robust basis for stock status determinations, all provide a reasonable basis to conclude that the harvest strategy is responsive to the state of the stock and all of the elements work together to achieve the stock management objectives reflected in criteria 1A (i). |
|||
|
Orange roughy – Cascade Plateau |
LOW RISK |
||
|
The Cascade Plateau and Eastern Zone orange roughy fisheries are currently managed as Tier 1 species under the HSF. In October 2006, orange roughy was listed as conservation dependent under the EPBC Act and placed under the Orange Roughy Conservation Programme (ORCP). The ORCP was replaced by the Orange Roughy Rebuilding Strategy in 2015 (AFMA 2015b), the primary objective of which is to return all orange roughy stocks to levels at which the species can be harvested in an ecologically sustainable manner that is consistent with the HSP. The orange roughy rebuilding strategy allows limited, targeted fishing for orange roughy stocks that are above the limit reference point of 20 per cent of the unfished spawning biomass. Management actions to minimise fishing mortality and support rebuilding include deepwater closures, restricting of effort by limiting entry to existing fisheries, and ongoing research and monitoring to support stock assessments. Being the only orange roughy fishery to not be overfished, a requirement of the ORCP was to maintain the spawning biomass of orange roughy on the Cascade Plateau at or above 0.6 B0. In 2014, it was agreed that the default settings of the SESSF HSF would be adopted, with the standard target reference point of 0.48 B0 and the limit reference point of 0.2 B0 (SlopeRAG 2014b). Spawning aggregations of Cascade Plateau orange roughy were assessed using acoustic survey abundance indices between 2003 and 2009 (Georgeson et al 2016). Modelled estimates of spawning biomass, combined with recent low levels of catch, suggest that the stock is currently likely to be above target levels. The acoustic measures of spawning abundance, combined with modelled estimates of biomass and tools to effect changes in fishing mortality (TAC, ITQs, HCR), suggest that the harvest strategy is responsive to the state of the stock and all of the elements work together towards achieving the stock management objectives reflected in Criterion 1A (i). |
|||
|
Orange roughy – Eastern zone |
LOW RISK |
||
|
Following stock declines to 10% of initial biomass levels (0.10 B0) after overfishing in the 1980s and 1990s, the stocks have recovered to levels above the limit reference point (0.20 B0). A robust assessment of the stock has been undertaken, including analysis of life history characteristics which have appeared to have responded in a compensatory manner to these significant declines in abundance (Morison et al. 2013, Pitman et al. 2013). The assessment includes a model that provides robust estimates of biomass that can be used to monitor the fishery against the HSF. Given the close monitoring of stocks, the strong evidence that rebuilding has occurred in response to the implementation of the ORCP, and the implementation of the Rebuilding Strategy that only allows limited catches from fisheries above b20%, the harvest strategy appears to be responsive to the state of the stock and all of the elements work together towards achieving the stock management objectives reflected in Criterion 1A (i). |
|||
|
Pink ling – Eastern and Western |
LOW RISK |
||
|
Pink ling is a Tier 1 species under the HSF, with RBCs based on a model originally described by Cordue (2013). Because of the amount of effort required for the assessment and the availability of projections with associated probabilities, SlopeRAG concluded that there was little additional benefit from updating the assessment every year, and recommended three-year TACs based on RBCs for the east (122 t) and west (661 t) (SlopeRAG 2013a). Because of industry concerns that even without targeting it would be difficult to constrain eastern pink ling catches to this low level, Cordue (2013) provided projections of biomass under a range of constant-catch scenarios, from 0 to 500 t, together with probability estimates of stock status in relation to target and limit reference levels. Based on these projections, SEMAC recommended that AFMA set three-year TACs, commencing in 2014–15, of 349 t for eastern pink ling and 647 t for western pink ling, under the assumption that eastern gemfish catches could be effectively constrained. AFMA determined that implementing separate quotas would require a review of statutory fishing rights in the fishery. As a result, a global TAC of 996 t (1022 t after carryover of undercaught TAC from 2013–14) was set for pink ling for the 2014–15 season, with additional controls including a daily catch allowance for the eastern zone and a change in some concession conditions to restrict catch of pink ling from the eastern zone to 25 per cent of quota holdings. These arrangements were continued for the 2015–16 season, but with a TAC of 980 t and a tighter restriction on the daily catch allowance (175 kg per day). The Cordue (2013) assessment was updated in 2015 (Cordue 2015), with estimates for the eastern stock of 0.30 B0 in 2015 and the western stock 0.72 B0. This produced RBCs for the 2016–17 fishing season of 250 t for the east and 990 t for the west. TACs were again determined based on the constant-catch scenarios for the eastern stock. Catch of eastern pink ling reported in logbooks in the 2015–16 fishing season was 230 t, which was below the 337 t TAC and the 250 t RBC. Projections from the 2015 stock assessment suggested that the stock could be rebuilt to the target reference point (B) within one mean generation time (8.8 years) with catches up to 550 t per year for eastern stock, and for two mean generation times, total removals could be 400–500 t per year. Thus, current levels of fishing mortality are adequate to ensure rebuilding within appropriate timeframes. In late 2016, new informal management arrangements were introduced to further strengthen the ability to control the eastern pink ling catch cap. The 14 Eastern stock fishers now operate a voluntary quota trading system. The Eastern fishers are given an eastern “allocation” and if fishers want to increase their allocation then they need to “trade” (no formal agreement process is in place) with another of the 14 Eastern fishers. The process is informally managed through South Eastern Trawl Fishery Industry Association (SETFIA), however AFMA produce a weekly report to track catches in real time to ensure the catch cap is not being exceeded. Based on the above, the harvest strategy is responsive to the state of both the eastern and western the stocks of pink ling, and all the elements work together towards achieving the stock management objectives reflected in Criterion 1A (i). |
|||
|
Gemfish – Eastern |
PRECAUTIONARY HIGH RISK |
||
|
The integrated stock assessment model (tier 1) for eastern gemfish was last updated in 2010 (Little & Rowling 2011), with spawning stock biomass estimates of 15.6% of the 1968 level (0.156 SB0). The 2010 assessment provided biomass projections based on two scenarios: total catches of 0 and 100 t each year. The projection for zero catch suggested that the biomass might reach 0.20 SB0 (the limit reference point, LRP) by 2017, while projections for annual catches of 100 t reached the LRP in 2025 (Little & Rowling 2011). The 2008 eastern gemfish rebuilding strategy adopted a time frame of nine years to reach the LRP, however given poor recent recruitment AFMA believed that this time frame was unlikely to be met (AFMA 2015a). The updated 2015 rebuilding strategy has adopted the rebuilding time frame of one mean generation time plus 10 years (approximately 19 years from 2008), which is in line with the HSP. The rebuilding strategy aims to rebuild eastern gemfish to, or above, the limit reference point by 2027. The main uncertainty in the harvest strategy appears to be the extent to which incidental bycatch limits are complied with. Georgeson et al (2016) note that the “rebuilding projection is based on average levels of recruitment and assumes that total removals are limited to the 100 t incidental catch allowance. Total removals were likely to have been about double the 100 t incidental catch allowance in 2013–14 but below the incidental catch allowance in 2014–15.” They also note that discard data for 2015 are not available and “it is unclear whether total mortality for eastern gemfish remained below the incidental catch allowance prescribed in the rebuilding strategy”. On that basis, they conclude it is uncertain if overfishing is occurring. Although the 2015 rebuilding strategy could be expected to result in stock size increasing to the limit reference point in 2027 based on modelling (and from there rebuild towards BTARG in accordance with the SESSF harvest strategy), there is limited evidence of rebuilding at this stage and compliance with incidental catch limits has been variable in recent years. Accordingly, we have scored this SI precautionary high risk. Nevertheless, Georgeson et al. (2016) report that “industry continues to work to reduce catches of eastern gemfish. Targeting of eastern gemfish has declined since 2008, and total removals are at historically low levels. Analyses presented to ShelfRAG in 2012 suggested that the targeted catch of eastern gemfish by otter trawl declined to between 10 and 20 t (15–30 per cent of the catch) in 2011 (N Klaer, CSIRO, 2013, pers. comm.). The high estimates in the range are from strata with fewer than five shots, which might suggest that, although eastern gemfish was the most valuable species, catches were not intended.” The fishery would be better positioned against this SI with greater certainty that incidental catches were consistently within the limits set out in the rebuilding plan. |
|||
|
Gemfish – Western |
MEDIUM RISK |
||
|
An integrated stock assessment model (tier 1) was developed for western gemfish in the CTS and the GABTS in 2011, and was last updated in 2013 (Chambers et al. 2014). The most recent assessment gave a spawning biomass estimate of 74% of unfished biomass in 2013 (0.74 SB0). Georgeson et al (2016) report that GABRAG had some concerns regarding the tier 1 assessment, and thus a tier 4 assessment was also conducted (Haddon 2013b). While there were also some concerns regarding the reliability of the tier 4 assessment (e.g. CPUE may not be a reliable indicator of abundance given the stock may be targeted in spawning aggregations; Georgeson et al 2016), it was used to establish a TAC for the CTS. The RBC for the CTS component of the stock for the 2015–16 fishing season was 247 t, and the TAC set for the CTS by the AFMA Commission was 183 t for 2015–16. There is no quota for the GAB component of the stock, with reliance instead on a catch trigger where a full assessment must be undertaken if catch exceeds 1000 t over three years (AFMA 2014a). Catches and standardised CPUE have been stable in recent years, and catches are low as a proportion of the RBC and below the Great Australian Bight catch trigger (Georgeson et al 2016). Given that a TAC has been implemented for the CTS component of the stock and catches within the GABTS are below the catch trigger, the harvest strategy could be expected to achieve the stock management objectives reflected in criteria 1A (i). The main uncertainty is the extent to which the harvest strategy is responsive to the actual state of the stock given uncertainties in assessments. Accordingly, we have scored this SI medium risk. |
|||
|
(b) Shark-finning |
|||
|
NA |
|||
|
CRITERIA (ii): There are well defined and effective harvest control rules (HCRs) and tools in place. |
|||
|
(a) HCR Design and application |
LOW RISK |
||
|
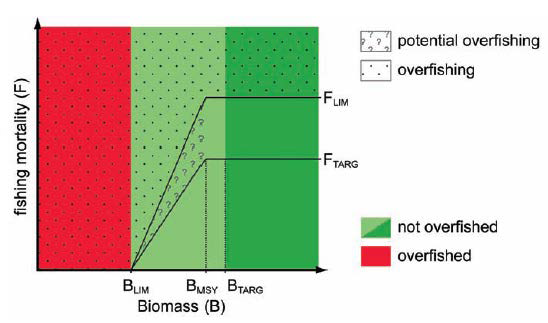
Well-defined HCRs are set out for each Tier 1-4 species covered by the SESSF HSF (AFMA, 2015a). HCRs are designed to achieve the objectives set out in the HSF which in turn has been designed to meet the Commonwealth HSP (DAFF, 2007). Under the HSF, for Tier 1 stocks the target fishing mortality rate FTARG represents the fishing mortality rate that would result in a spawning biomass of BTARG (equal to BMEY). The default value for FTARG is F48, the value of F corresponding to a BTARG of B48. Alternative reference points may be adopted for some stocks to better pursue the objective of maximising economic returns across the fishery as a whole. The recommended maximum fishing mortality rate for Tiers 3 and 4 is FMSY (the default proxy for which is F40). This represents the fishing mortality rate that would cause the spawning biomass to decline to its maximum sustainable biomass (BMSY) (the default proxy for which is B40). The breakpoint, or HCR inflection point, in the overfishing line in Figure 11 occurs at a biomass corresponding to BMSY. If B<BMSY or F>FMSY, the TACs should be reduced to limit fishing effort and the fishing mortality rate. For Tier 1, the recommended maximum fishing mortality rate and HCR inflection point occurs at a proxy of F35.
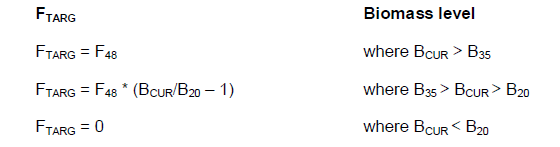
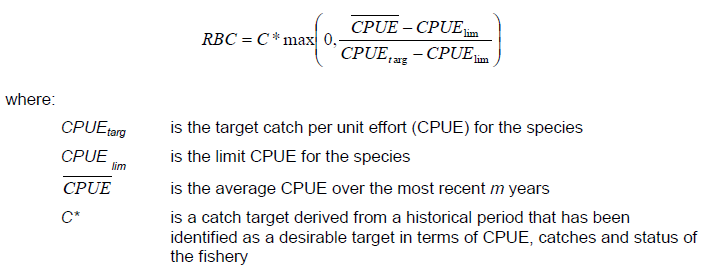
Figure 8: Schematic representation of a harvest control rule, showing key reference points (Source: AFMA, 2015a) Recommended Biological Catch (RBC) is calculated according to the following (AFMA, 2015a): Tier 1 The formula for calculating FTARG is as follows:
The RBC is calculated by applying FTARG to the current biomass BCUR to calculate the total catch (including discards) in the next year, using the agreed base case assessment model: At Tier 1, BLIM = B20, the maximum value for FTARG = F48 and the breakpoint in the HCR occurs at B35. Alternative reference points may be adopted for some stocks to better pursue the objective of maximising economic returns across the fishery as a whole. The HCRs are robust to the main uncertainties (SI(b)) as they have been developed over a period of time involving world leading scientists, underpinned by publications in peer-reviewed journals. There is substantial evidence that the HCRs have been successfully implemented across a diverse range of gear types and species of Commonwealth fisheries (SI(c)). Additional HCRs are also applied for specific fisheries or species where necessary, developed through the Resource Assessment Group, and applied and monitored by AFMA. Tier 4 The Tier 4 control rule is of the form:
A range of considerations are then taken into account in translating the RBC into a TAC. For Tier 4 species a ‘discount factor’ of 15% is applied to account for greater levels of uncertainty in these stocks. Other sources of mortality including state catches, discards and any research catch allowance are then subtracted from the RBC to produce a Commonwealth TAC. Multi-year TACs are to be applied for all Tier 1 and Tier 4 species where suitable. Where the RBC is zero, an incidental bycatch TAC may be set after considering a range of circumstances including the impact of incidental catches on rebuilding of the stock. Accordingly, for all stocks managed as Tier 1-4 under the SESSF HSF, well-defined HCRs are in place that are robust to the main uncertainties, ensure that exploitation is reduced as PRI is approached and are expected to keep the stock fluctuating at or around a target level consistent with MSY (or above) |
|||
|
PI SCORE |
LOW RISK – Blue grenadier, Blue eye trevalla, Orange roughy – Cascade, Orange roughy – eastern, Pink ling – Eastern and Western |
||
|
MEDIUM RISK – Gemfish –Western |
|||
|
PRECAUTIONARY HIGH RISK – Gemfish – Eastern |
|||
|
CRITERIA: (i) Relevant information is collected to support the harvest strategy. |
||||
|
(a) Range of information |
LOW RISK |
|||
|
Comprehensive information on fleet composition, catch and other fishery-wide indicators is collected through the monitoring programs described in AFMA (2015a). In 2015-16 fishing season there were 57 trawl vessels in the CTS, although only 38 were active (Georgeson et al, 2016). Catch data are collected through compulsory logsheets and catch document records. Blue grenadier There is comprehensive information available on the life history, stock structure, fishing fleet composition, catch data and other data to support the harvest strategy for blue grenadier. A recently completed stock structure study using otolith chemistry and otolith shape from Australian specimens (Hamer et al. 2009) has provided evidence that there is more than one stock of blue grenadier being fished within the SESSF. Specifically, the otolith indicators provided support for separate stocks of blue grenadier being fished by the Great Australian Bight Trawl (GABTS) and Commonwealth Trawl Sector (CTS) of the SESSF. Hamer et al. (2009) also indicated that blue grenadier from the western Tasmanian and eastern Bass Strait regions of the CTS were unlikely to be part of one highly mixed south eastern Australian stock. Other sources of regular monitoring are summarised in AFMA (2015). There is sufficient relevant information available for blue grenadier to support the harvest strategy. Blue-eye Trevalla For assessment purposes, it is assumed that there is one Australian blue-eye trevalla stock separate from the New Zealand stock(s). Genetic studies found no evidence of regional population structuring however, otolith microchemistry suggest that areas off New South Wales could be important for mixing (Georgeson et al. 2016). The biology of blue-eye trevalla is well understood, and is summarised in two FRDC reports (Baelde 1995; Paulovics and Williams 1995). As with all other Commonwealth fisheries, the composition of the fleet and the distribution of the catch are also well understood. In recent years the vessels targeting blue-eye trevalla have shifted from almost entirely dropline to almost entirely auto-longline and power handline. Notwithstanding the historical difficulties associated with understanding the impact of orca depredation and spatial closures on commercial CPUE, there is sufficient relevant information available for blue-eye trevalla to support the harvest strategy. Orange roughy Orange roughy within the Australian Fishing Zone form a single genetic stock (Gonçalves da Silva et al. 2012) However there is sufficient differentiation between regions that the fishery is managed and assessed as a number of discrete regional management units. Orange Roughy mainly occur between the depths of 700-1400 m, where they form dense spawning and feeding aggregations over rugged topographic features such as the edge of the continental shelf and seamounts. They also disperse more widely over smooth and rough bottom. The species is benthopelagic, generally occurring on the bottom but at times rising 50-100 m off the bottom to feed or spawn (Kailoloa et al. 1993, Branch 2001, Gomon et al. 2008). The biological traits of orange roughy are well understood. The 2014 Rebuilding Strategy (AFMA 2014b) summarises the biology as “Orange Roughy are slow growing to a maximum size of ~ 50 cm (Gomon et al. 2008), slow to mature (~ 30 years), have a mean generation time of about 56 years (J. Upston, pers. comm.) and long lived (> 100 years) (Kailola et al. 2003). They are synchronous spawners (Pankhurst et al. 1987) with spawning events occurring annually although individuals may not spawn every year (Bell et al. 1992). Males appear to spawn over a 1-2 week period and females spawn for up to one week producing between 10 000 and 90 000 large (2.0 – 2.5 mm diameter) eggs (Pankhurst et.al. 1987).” There is sufficient information to support the harvest strategy for orange roughy at the regional scale. Pink ling There is sufficient information available on stock structure, productivity and fleet size to support the harvest strategy, particularly now the eastern and western stocks are managed separated. Sexual maturity occurs at 4–5 years (60–72 cm TL) and longevity is about 28 years. Fishers have reported spawning aggregations in relatively shallow waters off western Tasmania (Strahan), and in waters at approximately 230 m off the east coast of Australia (Everard canyon near Lakes Entrance and Gabo Island) (Tilzey, 2000). Gordon (2005) provided a detailed overview of the relationship deepwater fishes have with the natural environment and indicated that there was a strong relationship between surface productivity and deepwater fish communities. Natural mortality of pink ling has been calculated, although there is a paucity of data available on the natural variability of natural mortality and the factors affecting spawning success. Pink ling are found in temperate latitudes of southern Australia and New Zealand in depths 200–900 m (more commonly at 300–550 m), although ocean currents may carry larvae into shallow shelf waters and inshore (Kailola et al., 1993). There is sufficient information to support the harvest strategy for pink ling. Gemfish There is sufficient information to suggest there are two biologically distinct stocks of gemfish in Australia: an eastern stock and a western stock, separated by a boundary at the western end of Bass Strait (Colgan & Paxton 1997; Moore et al. 2016). Eastern gemfish are distributed from Cape Moreton, southern Queensland, along the east coast to Bass Strait and the waters off Tasmania. Western gemfish are distributed from Ningaloo Reef and Geraldton through the Great Australian Bight (AFMA 2015c). Eastern gemfish are mesopelagic and inhabit waters from 100 m to 700 m but are generally found at 250 m – 500 m deep. They are generally caught close to the sea floor but the fish are likely to move into mid-water at times (Kailola et al. 1993; Pogonoski et al. 2002). Their life history characteristics are well understood and are summarised in the 2015 Eastern Gemfish Rebuilding Strategy (AFMA 2015c). The composition of the fleet and the distribution of the catch are very well understood, particularly for Eastern gemfish in recent years when efforts to reduce potential targeting have required scrutiny of catch and effort data to the vessel level. There is sufficient relevant information available to support the harvest strategy for both Eastern and Western gemfish. |
||||
|
(b) Monitoring and comprehensiveness |
LOW RISK |
|||
|
Generic monitoring arrangements in place for the SESSF are described in the HSF (AFMA, 2015). These include: Logbooks and catch records AFMA requires fishers to record catch and effort information in logbooks at sea, and in catch disposal records (CDRs) which record the actual landed catch at port. CDRs are considered more accurate than logbook records. The following data is recorded for each fishing operation: the port and date of departure and return; gear type and fishing method; number of fish kept and discarded; and resultant catch including what is included in the weight (e.g. trunked, gutted, filleted, whole). Further information on logbooks and CDRs is available at: http://www.afma.gov.au/services-forindustry/logbooks-and-catch-disposal/current-logbooks-and-catch-disposal-records/. The Integrated Scientific Monitoring Program (ISMP) A key component of the ISMP is the sampling and recording of catches at ports and on board fishing vessels using fishery-independent observers. The purpose of the ISMP is to provide reliable, verified and accurate information on the fishing catch, effort and practice of a wide range of vessels operating inside and, periodically, outside the Australian Fishing Zone. Biological and environmental data are collected on: catch composition including size and weight; amount and type of incidental catch; number of fish kept and discarded; fate of target and non-target species; interactions with TEP species; and fishing effort. Further information on the Observer program is available at: http://www.afma.gov.au/services-forindustry/observer-program/. Fishery Independent Surveys (FIS) The FIS is an industry-based fishery-independent resource survey which provides a timeseries of relative abundance indices for key target species. A FIS has been conducted for key target species in the SESSF since 2008. Biological and environmental data are collected such as: target species; catch rate (kg/shot); fishing method; and fishing depth. Information which provides a relative abundance index of other main byproduct and incidental catch species is also obtained. Stock abundance is monitored through models of varying sophistication based on data availability for Tier 1, 3 and 4 species. All UoA removals, including state catches and discards, are estimated in TAC decision making. Accordingly, for all Tier 1-4 species stock abundance and UoA removals are regularly monitored at a level of accuracy and coverage consistent with the HCR and there is good information on all other removals from the stock. |
||||
|
CRITERIA: (ii) There is an adequate assessment of the stock status. |
||||
|
(a) Stock assessment |
||||
|
Blue grenadier |
LOW RISK |
|||
|
The assessment model included data on catches in the Great Australian Bight Trawl Sector (GABTS) (only 10 t in 2010/11), and there is negligible take of this species by other commercial sectors. Recreational take is also negligible. The assessment uses a population dynamics model originally developed for blue grenadier in the South East Fishery by Punt et al. (2001). Two sub-fisheries are included in the model – the spawning sub-fishery that operates during winter (June – August inclusive) off western Tasmania (zone 40), and the non-spawning subfishery that operates during other times of the year and in other areas throughout the year (Tuck, 2008). The model is sex dis-aggregated. However, male and female fish are assumed to grow at the same rate. Parameter uncertainty is examined through the use of sensitivity tests and by applying the Markov Chain Monte Carlo (MCMC) algorithm (Hastings, 1970; Gelman et al., 1995; in Tuck, 2008). The stock assessment was updated in 2013 (Tuck 2013), incorporating data to the end of 2012, as well as estimates of spawning biomass from industry-based acoustic surveys (2003 to 2010) and egg survey estimates of female spawning biomass (1994 to 1995). The assessment is appropriate for the stock and estimates stock status relative to reference points that are appropriate to the stock and can be estimated. |
||||
|
Blue eye trevalla |
LOW RISK |
|||
|
The assessment for blue-eye trevalla is a Tier 4 assessment and is based on standardized commercial CPUE data (Georgeson et al. 2016). The assessment assumes one blue eye trevalla stock across the entire SESSF. While the assessment is considered adequate to assess stock trends, there has historically been some uncertainty associated the impacts that orca depredation and spatial closures for dogfish have had on CPUE trends in recent years. The standardized CPUE was re-assessed in 2015 using a revised catch per hook metric in the Tier 4 analysis in place of the previously used catch per record/day (AFMA, 2015d). SlopeRAG considered the updated analysis to be a better reflection of CPUE in the early part of the fishery. The updated analysis confirmed that the previous Tier 4 assessment was conservative in nature, and that blue-eye trevalla are likely to be less depleted than the 2014 assessment indicated. Tier 4 assessments do not assess the probability of being below the reference point. However, the RAG considers the current assessment to be conservative. Tier 4 species use CPUE targets as a proxy of biomass targets (AFMA, 2015d). The Tier 4 target reference point is the level of CPUE assumed to produce a spawning biomass of 48 per cent of unfished levels. The limit reference point is 20 per cent of unfished levels. Based on this information, the stock assessment appears to be appropriate (and highly precautionary) for the stock and it is assessed against reference points that are appropriate for the stock and can be estimated. |
||||
|
Orange roughy |
LOW RISK |
|||
|
Separate models have been developed for the Cascade Plateau and Eastern Zone orange roughy stocks. Both models are underpinned by estimates of spawning biomass from acoustic surveys. Spawning aggregations, and thus acoustic survey results, appear to be strongly impacted by the environment on the Cascade Plateau (Georgeson et al. 2016). As a consequence, the largest survey result rather than the average, from surveys conducted between 2003 and 2009 were used for modelling purposes. To offset this increased uncertainty, the relatively light scale and intensity of the catch history, combined with the optimistic model projections that are well above target levels, provides confidence that the stock assessment is appropriate for the stock and is assessed against reference points that are appropriate for the stock and can be estimated. In contrast, the Eastern Zone fishery was heavily fished historically, with biomass estimates declining as low as 0.1 B0 in the 1990s. There is strong evidence that compensatory factors in the life history of this stock has aided recovery to levels above the limit reference point (0.2 B0). Given the Orange Roughy Rebuilding Strategy (AFMA 2015b) allows for some fishing of stocks above 0.2 B0, there has been considerable effort afforded to modelling of the Eastern Zone stock. This includes a Markov chain Monte Carlo(MCMC) analysis of the probabilities around various model outcomes (Upston et al. 2014) which provided increased confidence in the modelling outcomes despite narrow confidence intervals that may have reflected some model constraints. Based on this information, the stock assessment appears to be appropriate for the stock and it is assessed against reference points that are appropriate for the stock and can be estimated. |
||||
|
Pink Ling |
LOW RISK |
|||
|
Pink ling has been assessed using quantitative, model-based (Tier 1) stock assessments since 2003. Annual integrated, age-structured assessments using catch-at-age data and standardised CPUE abundance indices were run using Stock Synthesis software from 2006 to 2012. The 2012 Stock Synthesis model produced by Punt et al. (2012) was updated again in 2013. The Cordue (2013) model was taken through to full MCMC probability analysis for the eastern stock to provide estimates of probabilities around results. SlopeRAG agreed to use this as the base-case model for providing advice. Results of the CASAL model indicated the biomass of the western stock of pink ling to be stable at around 0.58 B0, ranging from 0.41 to 0.86 B0 in MCMC analyses. The biomass of the eastern stock of pink ling was estimated to be around 0.25 B0, ranging from 0.17 to 0.38, and trending upwards. The Cordue (2013) CASAL based model was updated in 2015 (Cordue, 2015). Changes to the model structure and data inputs are summarised in AFMA (2015d) and included further analysis of eastern selectivity and estimates of natural mortality (M) following MCMC runs. The assessments are appropriate for the stock and estimates of stock status relative to reference points are appropriate to the stocks of Pink Ling, and these estimates are available. |
||||
|
Gemfish |
MEDIUM RISK |
|||
|
Eastern gemfish is managed as a Tier 1 species with an integrated stock assessment model last updated in 2010 (Little & Rowling 2011). Spawning stock biomass was estimated at 0.156 SB0, with biomass projections based on a scenario of zero catch and 100 t catch per year. The projections for zero catch suggested that the biomass might reach 0.20 SB0 (the limit reference point, LRP) by 2017, while projections for annual catches of 100 t reached the LRP in 2025 (Little & Rowling 2011). However, the expected recovery under standard recruitment conditions has yet to be observed in the available data. While this may be the result of environmental limitation in recruitment, the age of the assessment model (i.e. 2010) provides some uncertainty in the assessment of its adequacy, and as such this SI is scored as medium risk. An integrated stock assessment model (tier 1) was developed for western gemfish in the CTS and the GABTS in 2011, and was last updated in 2013 (Chambers et al. 2014). The most recent assessment gave a spawning biomass estimate above of 0.74 SB0, which was above target levels. Georgeson et al (2016) reported that “The Great Australian Bight Resource Assessment Group (GABRAG) had some concerns with the tier 1 assessments, particularly the increase in estimated biomass between assessments and uncertainties around stock structure”. Subsequently, a tier 4 assessment was conducted to augment the assessment which indicated that CPUE was above the limit reference point (Haddon 2013b). However, there were also concerns with the tier 4 assessment because it excluded catches in the Great Australian Bight, and CPUE may not be a good indicator of abundance for a species that is often targeted when it forms winter spawning aggregations (Georgeson et al. 2016). Despite these limitations, the tier 4 assessment was used to establish TAC for CTS component of the western region. Given the uncertainty in these models, and the age of the assessment, this SI is scored as medium risk. |
||||
|
(b) Uncertainty and Peer review |
LOW RISK |
|||
|
Stock assessments for all Commonwealth managed stocks are subject to peer review and judgement (i.e., ability to reject the assessment) in the relevant RAG and MAC. Blue Grenadier The assessment identifies and discusses the main sources of uncertainty (e.g. discards, natural mortality, large fluctuations in CPUE in the winter spawning fishery; Tuck, 2008), has taken advice from external experts in its development and is subject to review through the AFMA Slope RAG process. Blue-eye trevalla Blue eye trevalla is assessed using standardised CPUE only. Considerable uncertainties have been identified in the historical CPUE time series (e.g. the impact of orca depredation, spatial closures for dogfish, changes in fisher behaviour and gear type; Penny et al., 2014; SlopeRAG, 2015), however some of the main uncertainties (e.g. influences of ‘catch per record’ CPUE) were addressed through the recent move to catch per hook based standardisation (AFMA, 2015d). Other key uncertainties (e.g. orca depredation) were assessed under alternative Tier 4 analyses. Under these analyses, loss of catch due Orca interactions was treated as a discard (AFMA, 2015d). The Tier 4 with Orca-influenced catch rates suggested that the stock is more productive than the base case analysis that used non-whale affected catch rates. The RAG recommended that Orca-influenced catch rates not be applied to the Tier 4 analysis used to set the RBC. The RAG noted that the RBC will be a conservative estimate because these data are omitted. However, if depredation rates have declined exponentially that could explain the CPUE increase observed without any change in stock abundance. On this basis, it is arguable that uncertainties are taken into account, and the assessment is subject to a form of peer review through SlopeRAG. Orange Roughy Orange roughy assessments rely on acoustic surveys of spawning biomass. Uncertainty in the impacts of environmental drivers on acoustic survey results have been incorporated into the assessment for the Cascade Plateau stock. Given the proximity of the Eastern Zone biomass to the limit reference point, considerable research effort has been applied in understanding the impacts of model uncertainties. The scrutiny on these processes, and the thoroughness of peer review for orange roughy stock assessments is heightened because the species is operating under a Rebuilding Strategy that requires annual review. Pink ling Stock assessments are subject to peer review and judgement (i.e., ability to reject the assessment) in the RAG and MAC. The assessment identifies and takes into account the main sources of uncertainty. Gemfish Like orange roughy, Eastern gemfish are subject to a Rebuilding Strategy that requires annual assessment and review. The Eastern gemfish stock assessment identifies and takes into account the main sources of uncertainty, albeit that the assessment is now 6 years old. The Western gemfish assessment explicitly accounted for uncertainty in the Tier 1 assessment by conducting a Tier 4 CPUE analysis to augment the assessment. After considering uncertainties in both assessments, the Tier 4 result was used to set a TAC for the CTS. |
||||
|
PI SCORE |
LOW RISK – All stocks |
|||
COMPONENT 2: Environmental impact of fishing
|
CRITERIA: (i) The UoA aims to maintain other species above the point where recruitment would be impaired (PRI) and does not hinder recovery of other species if they are below the PRI. |
||||||||||||||||||||||||||||||||||||||||||||||
|
(a) Main other species stock status |
MEDIUM RISK |
|||||||||||||||||||||||||||||||||||||||||||||
|
In this assessment, main other species are assessed as those species that —
This criterion requires that: Main other species are likely to be above the PRI OR if the species is below the PRI, the UoA has measures in place that are expected to ensure that the UoA does not hinder recovery and rebuilding.
Observer data indicates that otter trawlers directly interact with 533 species, 360 of these are teleosts, 39 are skates/rays and 63 are sharks (Walker et al., 2006). However, the fishery regularly retains 28 target species and 95 byproduct species. The average annual retained catch by the CTS is 11,000 t, although when discards are included the average catch increases to approximately 13,800 t. For the purposes of determining the species/complexes caught at >5% volume for the CTS sector, data on total catch by species for 2015/16 was used (Georgeson et al. 2016). The reported total catch of quota species was 8057 t, with 312 t of ocean jacket also reported for a total CTS catch of 8369 t. Using the historic proportion of discards above, the total catch for the CTS for 2015/16 was 10499 t. Species exceeding 5% of the total catch (525 t) that were not assessed in P1 of this report were Eastern school whiting (733 t) and flathead (2908 t). Eastern school whiting are caught almost entirely by the Danish Seine sector of the CTS and thus do not need to be assessed here at P2. Species exceeding 2% of the total catch (210 t) that were not assessed in P1 of this report were mirror dory (252 t), silver warehou (276 t) and leatherjacket (312 t). Although it is likely these species would not be considered as vulnerable, they are assessed here regardless to increase the robustness of the assessment. Flathead For SESSF management purposes, ‘flathead’ refers to a group of at least 8 flathead species consisting predominantly of tiger flathead (Platycephalus richardsoni), but sand flathead (P. bassensis), southern flathead (P. speculator), bluespot flathead (P. caeruleopunctatus) and gold-spot or toothy flathead (P. aurimaculatus) are also caught regularly. Tiger flathead remains the dominant species in the catch and is the only species assessed in stock assessments at this stage. Data from onboard observers support catch data and indicates that P. richardsoni comprises over 95% of the SESSF catch of flathead (Morison et al. 2013); the results of aproductivity PSA suggest that the productivity of Tiger flathead is not significantly different to the other five species regularly encountered. It is therefore reasonable to assume they won’t be disproportionately impacted by stock management arrangements directed at tiger flathead. The flathead stock assessment is based on biological parameters relating to Tiger Flathead, which is the main contributor to catches. The assessment and TAC include catches of all flathead species because the different species cannot be distinguished in historical data. The most recent assessment (Day & Klaer, 2014) estimated spawning stock biomass in 2014 to be 11 572 t or 50 per cent of the unfished (1915) level. The spawning biomass that supports maximum sustainable yield (MSY) of Tiger Flathead was estimated to be 32 per cent of the unfished biomass. The biological stock is not considered to be recruitment overfished (Georgeson et al, 2016). The available evidence indicates that the stock is highly likely to be above PRI. Mirror dory Mirror dory is found throughout the southern Pacific Ocean at depths from 30 to 800 m. A single stock of mirror dory is assumed for management purposes (Morison et al. 2013), although Morison et al. (2012) suggested a probable separation east-west of Bass Strait. Because of the ongoing uncertainty in the tier 3 assessments, ShelfRAG decided to base advice for 2013–14, 2014–15 and 2015–16 on tier 4 assessments using standardised CPUE (Haddon 2015). Georgeson et al (2016) state “Recent tier 4 assessments indicate that the recent average CPUE for the eastern and western stocks is above the limit reference point, and the stock is classified as not overfished.” On this basis, it is considered likely that the stock is above PRI.
Figure 9: Standardised CPUE for (a) western mirror dory, 1986 to 2014 and (b) eastern mirror dory, 1986 to 2014 (Source: Georgeson et al, 2016). Silver warehou Silver warehou is been managed as a Tier 1 species, with the first model completed in 2009 (Tuck & Fay 2010). In 2012, an update of the model-based assessment was performed and included updates of catch, discard, length, age and catch-rate data (Day et al. 2012). An updated tier 1 assessment was undertaken in 2015 (Thomson et al. 2015b), which used updated catch, discard, CPUE, length and age data. The updated assessment projected the 2016 spawning biomass to be 0.4 B0, and catches have remained well below TACs and RBCs since 2006. On the basis of this evidence, Georgeson et al (2016) state “Silver warehou therefore remains classified as not overfished and not subject to overfishing.”
Figure 10: Estimated spawning stock biomass for silver warehou, 1978 to 2014 (Source: Georgeson et al, 2016). Leatherjacket Stock status reports combine ‘unspecified leatherjackets’ with ‘Ocean Jacket’ (Nelusetta ayraud). In 2012, the CTS retained 269 t of Ocean Jacket and 133 t of various other leatherjacket species. Little is known about the biological structure of this multispecies stock, and the stock is considered to comprise a single stock for assessment and management purposes. Ocean jacket taken in the GABTS is assessed separately. Georgeson et al. (2016) state: “There is no formal stock assessment for ocean jacket. The standardised CPUE index increased substantially between 2003 and 2007, and remains high. Ocean jacket is therefore classified as not overfished. Despite recent high catches, catch rates have remained high compared with historical levels, and therefore ocean jacket is classified as not subject to overfishing”. On this basis, it is considered that Leatherjacket are likely to be above PRI.
17 species or species groups were assessed as at least precautionary high by Zhou et al. (2012). A subsequent analysis demonstrated that the SAFE assessment significantly overestimated the risk to Bight skate, with the risk reduced from Extreme High Risk to Medium risk following an improved, data-intensive methodology (Zhou et al. 2013). However, given that some uncertainty still remains on the stock status of 16 main other species, the measures in place to ensure the UoA does not hinder recovery or rebuilding are considered here. It is worth noting that this assessment evaluates ‘other species’ across the CTS as a whole. Future assessments may benefit from greater depth and spatial separation of other species to account for the differences in other species catch composition across different areas and depth zones in the fishery. AFMA employs an Ecological Risk Assessment for the Effects of Fishing (ERAEF) process for each Commonwealth fishery to determine risks posed by fishing on individual species. These outcomes are used here as a proxy for status of main other species in regards to PRI. Where the risk to a species is sufficiently high (in this assessment high risk and above), a strategy to ensure that the fishery does not pose a risk to recovery is required to pass as medium risk. The ERA is a four step process:
The first SAFE assessment was conducted in 2007 (Zhou et al. 2007). From this and previous Level 1 and Level 2 analyses, a Level 2 Residual Risk Assessment (AFMA 2012) was published. The ERM identified a priority list of species to be assessed by the fishery, defined as those that were precautionary high risk or greater from the Level 2 and Level 3 assessments. In 2012, an updated SAFE assessment was completed (Zhou et al. 2012) for the CTS that identified a suite of additional species, including main other species, as precautionary high risk or greater risk. In 2014, residual risk guidelines were applied to the outcomes of the 2012 SAFE assessment for all teleost and chondrichthyan species (AFMA, 2014c). At the completion of this process, a final list of 9 non-ETP species were identified as priorities to be treated through the SESSF ERM Strategy 2015 (AFMA, 2015e). Table 1: Priority species for the CTS identified through the ERA process (AFMA, 2015e).
HR –High Risk While there is uncertainty about the current status of the high-risk species in relation to PRI, the CTS has a number of measures in place to monitor, assess and manage impacts. These are outlined in the SESSF ERM Strategy (AFMA, 2015) and include:
The overall aim of the SESSF ERM Strategy 2015 is to:
Accordingly, while there remains some uncertainty on the status of nine non-ETP species assessed as high risk or greater by AFMA (2014c) in relation to PRI, the fishery has measures in place that could be expected to ensure the UoAs do not hinder recovery and rebuilding if necessary. The strong recent history of the management agency in taking action to address known high risk areas (e.g. dogfish closures, nil TACs, etc) provides some confidence that the outcomes of the ERA process will be acted on. Further, ongoing improvements in the ERA methodology have resulted in the downgrading of risk ratings to at least some species (e.g. Bight skate) as more information is known, and application to other high risk species may produce similar results (Zhou et al, 2013). On this basis, the UoAs meet the medium risk SG. |
||||||||||||||||||||||||||||||||||||||||||||||
|
CRITERIA: (ii) There is a strategy in place that is designed to maintain or to not hinder rebuilding of other species; and the UoA regularly reviews and implements |
||||||||||||||||||||||||||||||||||||||||||||||
|
(a) Management strategy in place |
LOW RISK |
|||||||||||||||||||||||||||||||||||||||||||||
|
In general, the harvest strategy in the CTS consists of:
Each of these elements contributes towards a strategy that aims to maintain main other species above PRI. In addition, AFMA has a clear, well-documented strategy for addressing the risks of fishing posed on other species. This includes the application of an ecological risk assessment process. The Ecological Risk Assessment for the Effects of Fishing (ERAEF) employed for the fishery was a five step process:
The ERA process is documented in the SESSF ERM Strategy (AFMA, 2015e). Actions are implemented into the bycatch and discard workplan (AFMA 2014d). Under the SESSF Management Plan 2003, AFMA is required to develop and implement a bycatch action plan (now referred to as a Bycatch and Discarding Workplan) to ensure that information is gathered about the impact of the Commonwealth Trawl Sector (CTS) on bycatch species, that all reasonable steps are taken to avoid incidental interactions with Threatened, Endangered and Protected (TEP) species, and that the ecological impacts of fishing on habitats are minimised. The CTS has a relevant workplan in place (AFMA 2014d). Although past Commonwealth bycatch & discard plans did not deal directly with retained bycatch (byproduct), the current workplan for the CTS does include a strategy to address the catch of non-quota species. The objectives of the current workplan include:
Furthermore, the more frequent quota reconciliation system introduced in the SESSF has also had a beneficial effect on discard rates by preventing operators who are over-quota on one or more species from continuing to fish (and discard) those species. This system prevents fishers from continuing to fish during the fishing year until they reconcile all of their over-quota catches (AFMA, 2009). The harvest strategy framework, the ERA process, and the implementation of on-water actions through the bycatch and discard work plans is likely to be considered as at least a partial strategy that is expected to maintain or to not hinder rebuilding of the main other species at/to levels which are highly likely to be above the PRI. |
||||||||||||||||||||||||||||||||||||||||||||||
|
MEDIUM RISK |
||||||||||||||||||||||||||||||||||||||||||||||
|
The SESSF ERM Strategy 2015 (AFMA 2015e) and Bycatch and Discarding Workplan 2014-6 (AFMA 2014d) provide the framework for addressing main other species for the fishery, based on the ERA five-tiered process. These measures have been developed in consultation with SEMAC and other experts (e.g. CSIRO) as necessary. The measures are considered likely to work based on plausible argument, and therefore meet the medium risk SG, and may meet the low risk SG if there is evidence from future risk assessments that the measures have been implemented successfully. |
||||||||||||||||||||||||||||||||||||||||||||||
|
(c) Shark-finning |
LOW RISK |
|||||||||||||||||||||||||||||||||||||||||||||
|
Shark-finning is not permitted in the SESSF (Further information on the provisions for processing at sea are available in the SESSF Management Arrangement booklet 2014-15[2]). Existing levels of observer coverage and compliance monitoring is probably sufficient to verify the absence of shark finning to low risk levels. |
||||||||||||||||||||||||||||||||||||||||||||||
|
CRITERIA: (iii) Information on the nature and amount of other species taken is adequate to determine the risk posed by the UoA and the effectiveness of the strategy to manage other species. |
||||||||||||||||||||||||||||||||||||||||||||||
|
(a) Information |
LOW RISK |
|||||||||||||||||||||||||||||||||||||||||||||
|
The CTS is a multi-species fishery with numerous target species. AFMA’s ERA process, in addition to information provided through daily catch and effort logbooks, catch disposal records, protected species reporting, observer monitoring and VMS monitoring, provides sufficient quantitative information to assess the UoA related mortality on other main species, and to support a management strategy. The role of an observer is to collect independent, accurate and reliable data on Commonwealth fishing operations, catches and interactions with the environment by the boat and its fishing gear. This is achieved through:
In the CTS, coverage rates are developed by AFMA in association with the RAGs. In 2015/6 the coverage target was 144 sea days, allocated across different geographical regions and times of the year. The risks that the otter trawl sub-fishery of the CTS poses to the sustainability of the marine ecosystem have been assessed through the application of a progression of risk assessment methodologies as listed below:
Further information is available in the SESSF ERM Strategy (AFMA, 2015e). Notwithstanding uncertainties around the population status of some high risk species, these monitoring programs provide quantitative information that is adequate in most cases to assess the impact of the UoAs on other species and to detect increases in risk. The main uncertainties, currently being addressed through the Bycatch and Discarding Workplan, is the absence of information on some precautionary extreme high risk and high risk species. |
||||||||||||||||||||||||||||||||||||||||||||||
|
PI SCORE |
LOW RISK |
|||||||||||||||||||||||||||||||||||||||||||||
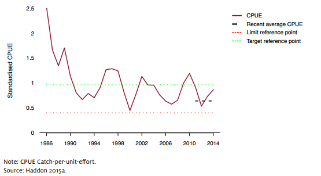

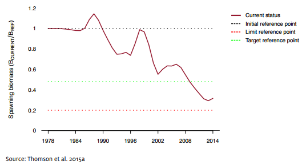
|
CRITERIA: (i) The UoA meets national and international requirements for protection of ETP species. |
||||
|
(a) Effects of the UoA on populations/stocks |
|
|||
|
Blue grenadier, Blue eye trevalla, Pink ling – eastern |
PRECAUTIONARY HIGH RISK |
|||
|
Orange roughy – Cascade, Orange roughy – Eastern, Gemfish – Eastern and Western, Pink ling – Western |
MEDIUM RISK |
|||
|
At least 201 ETP species are thought to occur in the area of the CTS, including: three species of sharks/rays, 79 species of seabirds, 49 species of marine mammal, seven species of marine reptiles, and 63 species of syngnathids. Protected species interactions are reported on the AFMA website: http://www.afma.gov.au/managing-our-fisheries/environment-and-sustainability/protected-species/. For all ETP species, the risk that the fishery poses has been extensively assessed through the application of an Ecological Risk Assessment of the Effects of Fishing (ERAEF) process. The outcomes from these risk assessments are updated on an ongoing basis, with high risk species tabled in the SESSF ERM Strategy 2015 (AFMA 2015). These species are:
A further five species that are listed as ‘conservation dependent’ under the EPBC Act and therefore could be considered ‘recognised’ under national environmental legislation (MSC, 2014). These include:
Pinnipeds The areas fished by the SESSF overlap with the distributions of the Australian fur seal (Arctocephalus pusillus doriferus), New Zealand fur seal (A. forsteri) and Australian sea lion (Neophoca cinerea). Fur seal populations have recovered substantially following heavy harvesting in the 18th and 19th centuries, with conservative best estimates of current abundance of 87,424 (S.E. 10,415) published in 2016 (Mackay et al. 2016). Australian sea lions are currently listed under the EPBC Act as vulnerable and there is a legal recovery strategy in place under the EPBC Act (DSEWPC 2013). Only the Australian fur seal was identified as high risk from the CTS sector. Mackay et al. (2016) estimated Potential Biological Removal (PBR), which is, conceptually, the maximum number of anthropogenic mortalities a marine mammal population can sustain while still allowing that “stock” to reach or maintain its optimum sustainable population. The method is sensitive to a range of recovery factors (RF) with estimates of PBR ranging from 2,623 to 4,721 for RF values of 0.5 to 0.9, respectively. In other words, the population could sustain human induced mortalities of at least 2,600 seals annually with a high degree of confidence in this measure. There is a potential for interactions with Australian fur seals(AFSs) in the CTS wet-boat sector (wet-boats being non-freezer operations) as identified by the ERA process. Early studies suggested that more than 700 seals may be caught annually in the wet-boat sector of the CTS (Stewardson & Aust. 2007). Georgeson et al. (2016a) reported that “comparisons between logbook and observer data suggest that there is still some level of under-reporting of pinniped interactions. In 2015, 134 pinniped interactions were reported in CTS and GHTS logbooks: 1 with an Antarctic fur seal, 2 with Australian sea lions, 3 with New Zealand fur seals, 88 with Australian fur seals and 40 with seals of unknown species. This is a decrease from the 167 interactions reported in 2014 and the 259 interactions reported in 2013. Of the 134 reported pinniped interactions, the Antarctic fur seal, the 2 Australian sea lions, 2 of the 3 New Zealand fur seals, 74 of the 88 Australian fur seals and 25 of the 40 unspecified seals were reported to be dead.” Koopman et al. (2014) examined the potential for the use of shortened cod-ends to reduce interactions. In their report, they state “interactions with a total of 44 AFSs were recorded during the 1,117 fishing operations conducted by the Western Alliance during 14 February 2013 to 17 August 2014 (Table 2). This information is valuable as it the single-most long-term verifiable reporting of TEP interactions of a vessel in the CTS. Of the total of 44 AFSs, 9 were recorded as released alive, while 35 were dead”. Extrapolation of these figures to total trawl effort suggests that the annual level of seal interactions would be around 500. While this rate of interaction does confirm there is a discrepancy with logbooks, the level of mortality is well below the PBR for the species. Therefore, it can be concluded that the effects of the fishery on the species are known and highly likely to be within National limits and the direct effects of the UoA are highly likely to not hinder recovery of the species. Cetaceans In 2013, 1 dolphin (undefined species) was caught and discarded dead. Thus, dolphin mortalities are a rare event and this is verified by independent observers. Accordingly, it is highly likely the fishery is not preventing the population from recovering. Seabirds The Albatross and Giant Petrel National Recovery Plan (DSEWPC 2011) states “The most pervasive threat to albatross and giant petrel survival is the accidental mortality and injury arising from interactions with human fishing activities.” The first Recovery Plan was prepared in 2001, with a strong focus on the longline sector that resulted in the development of a Threat Abatement Plan (COA 2014) that was specific to the long-line sector. While the current Recovery Plan identifies several overarching and specific objectives for the recovery of albatrosses, there are no direct limits placed on mortality. For trawl fisheries, seabirds are vulnerable to injury as a result of striking the trawl warps during fishing operations, and this occurs predominantly when offal are being discarded (Favero et al. 2011). Phillips et al. (2010) documented observer data from the CTS in 2006 that indicated that 31 shy albatross and 9 black-browed albatross were “captured” from 856 observed trawls. One of the limitations of assessing sea bird mortalities from warp strikes is that it is difficult to determine the proportion that survive. Phillips et al. (2010) chose to include all heavy interactions with the warp wire as “captures” even if the bird initially survived the interaction, due to uncertainty in post-interaction mortality, potentially resulting in over-estimation of the mortality rate. However, it was also noted that the observer data were not collected with the explicit aim of recording seabird interactions and thus some interactions were likely to have been missed. Phillips et al. (2010) concluded that “If the numbers observed in the 2006 calendar year are typical of other years, then reducing the seabird mortality in trawl fisheries (namely the CTS) should be a priority for the development of mitigation measures.” Phillips et al. (2010) also highlighted the substantial discrepancy between the reporting of seabird interactions in commercial logbooks compared to the rates reported by observers. This issue remains, with Georgeson et al (2016) stating “seabird interactions are probably under-reported for numerous reasons, including that it may be difficult to constantly observe seabirds interacting with fishing gear and vessels, and that seabirds may not have visible injury after interactions such as warp strikes.” In 2012, a “Residual Risk Assessment of the Level 2 ERA” was conducted (AFMA 2012) that included assessments for seabirds. The initial assessment involved a Probability Susceptibility Analysis (PSA), while a secondary “Revised” process allowed for additional information to be assessed following a series of “guidelines”. The two species assessed by Phillips et al. (2010), shy albatross and black-browed albatross, were both assessed as medium risk from both the PSA and the Revised process. Several other albatross species were identified as high risk from the PSA and were reduced to medium risk in the Revised process “under Guideline 7 as management strategies had been implemented which reduce the bycatch of these species”. The group “Albatrosses – species unidentified” was high risk after the PSA and remained high risk after the Revised process. The justification for retaining the high risk was “Twelve Albatrosses (species unidentified) were caught or interacted with in 2010 and 16 in 2011; all except one animal were deceased. It has been considered that it is a TEP species and the number of interactions that have occurred and no guidelines were applied which means the risk rating remains the same.” Thus the key outcome from the Level 2 Risk Assessment was that the group of unidentified albatrosses were the only high risk category. It should be noted that this analysis did not include the new gear technologies that significantly reduce the probability of interaction. Recently, results were published from a model that integrated environmental and demographic data to simultaneously analyse the impact of climate change and fishing mortality on shy albatross (Thomson et al. 2015). The model used long-term, annual population statistics from Albatross Island which represents approximately 35% of the total population of shy albatross. Albatross were previously hunted for their feathers and it was estimated that there were 2300 breeding pairs in 1972/73, with slow population recovery over time resulting in 5,233 breeding pairs in 2009/10, about 45% of the estimated levels before exploitation. Fishery catch and effort data were applied in the model on a regional basis for all years up to and including 2010 for all potentially impacting fisheries. The capture rate of 36 birds per thousand trawls was used in the model based on Phillips et al. (2010), however it must be noted that the model results were not dependent upon these estimates as combined fishing mortality rates (from all gear types) were also estimated as a parameter within the model. Additionally, sensitivity studies on the trawl fishery observer mortality rates were examined. The model did not aim to directly assess the impact of the fisheries on the current albatross population, with the key result being that predicted increases in temperature due to climate change were likely to significantly impact on the albatross population, and that reductions in the impacts from all fisheries of at least 50% were required to offset these changes for this species. While these results are informative, shy albatross were rated only as medium risk in the PSA. In the absence of information on other species, there remains considerable uncertainty in the current population sizes and recovery trends across most other albatross species affected by the CTS. Since 2010, AFMA and SETFIA have led several research projects on various approaches to mitigate the impact on seabird populations, and in the last two years several new devices have significantly and sequentially reduced the level of seabird interactions. In 2017, two new technologies have been legislated that will result in >90% reductions in seabird interactions (and by extension mortality). Given that the only high risk species are the “unknown” group, the issue remains one of a lack of information rather than known risks to these species. In the absence of this information, at this time it cannot be argued that the fishery is “highly likely to not hinder recovery” of all the albatross species. However, given the low numbers of annual mortalities in the unknown category, and the recently improved gear technologies that have been and are about to be implemented, it can be argued that the CTS is likely to not hinder recovery of these unknown species and thus this SI is assessed as medium risk. Upper-slope Dogfishes (Gulper sharks) Upper-slope gulper sharks were targeted in the SESSF, GABTF and NSW trawl fisheries in the 1980s and 1990s and this resulted in the stocks being substantially depleted. Targeted fishing appeared to have effectively ceased in 2002, due to declining catch rates (Wilson et al. 2009), but very small quantities are still taken as byproduct (within trip limits). Given the depleted state of the species (estimated to be <5–10 per cent of unfished levels on the upper slope off New South Wales, and unknown in other areas) the level of fishing mortality was considered too high to enable rebuilding, and three species of upper-slope gulper sharks (Harrison’s, Southern and Endeavour dogfish) were nominated for listing under the EPBC Act in 2008. The Endeavour Dogfish was found to be ineligible for listing in 2011 and consideration of the nomination of the other two species was extended until June 2012. In 2013, Harrison’s and Southern Dogfish were listed as ‘conservation dependent’ after meeting the eligibility Criterion for the ‘endangered’ listing. A rebuilding strategy is a requirement of the listing. In 2012-13, the reported Gulper Shark landings for the CTS and the GHTS combined were 0.9 t, having declined from 3.8 t in 2011–12. Landed catch continued to decline to 0.8 t in 2013–14. Reported annual discards from logbooks were 1.2 t in 2011–12 and 2012–13. Reported catch was 0.9t in 2015/6 (Georgeson et al, 2016), uncertainty remains around unreported and under-estimated discards. The Upper Slope Dogfish Management Strategy 2012 forms the basis of the rebuilding strategy and is designed specifically to rebuild the populations of Harrisson’s Dogfish and Southern Dogfish above a limit reference point (BLIM) of B25 (25% of unfished biomass) (AFMA, 2012b). The recovery time to B25 is estimated at around 86 years for Harrisson’s Dogfish, and 62 years for Southern Dogfish. The Strategy relies on a new network of spatial closures supplemented by a range of operational measures including regulated handling practices, 100% monitoring, move-on provisions and no retention of gulper sharks. The new Closure Network will provide protection, across the depth range, of 25% of the carrying capacity weighted core habitat of the continental slope stock of Harrisson’s Dogfish, 16.2% of the east stock of Southern Dogfish and 24.3% of the central stock of Southern Dogfish, in AFMA-managed waters. This closure network also protects 25% for Harrisson’s Dogfish, 25.9% for eastern Southern Dogfish, and 20.1% for central Southern Dogfish of core habitat area. The development of the strategy was supported by an Upper-Slope Dogfish Scientific Working Group which provided expert scientific advice on specific scientific questions to inform management and recovery of upper-slope dogfish species, as well as the normal AFMA consultative structure. The analysis undertaken during the development of the strategy provides some objective basis that the measures will work, although it is not clear at this point that the measures are being implemented successfully given there remains uncertainty over whether overfishing is occurring (Georgeson et al, 2016). Accordingly, this SI is scored medium risk. School shark While school shark are overfished, catch from the otter trawl fishery is not likely to hinder recovery of the species. School shark catch from the otter trawl sub-fishery was 16 t on average for the last 3 years. This is less than 10% of the total catch of the species in the south east. Mortality from the UoA is considered within the Rebuilding Strategy, and current total commercial fishing mortality is within the limits set by the revised Strategy (AFMA 2014e). Syngnathids Syngnathids are taken as bycatch in the CTS in otter-trawl and Danish-seine nets but they are generally small and difficult to observe among large catches of fish. The ERAEF noted that 61 syngnathids have the potential to interact with the fishery and of these, only one was classified as high risk. However, when these risks were elevated to the Level 3 SAFE assessment conducted by Zhou et al. (2012), there were no syngnathids identified as high risk. On the basis of this outcome, it is expected that impacts on syngnathids are known and highly likely to be within national limits. Blue Warehou Blue warehou has been classified as overfished since 1999 (Georgeson et al 2016). In February 2015, the species was listed as conservation dependent under the Environment Protection and Biodiversity Conservation Act 1999 (EPBC Act). The stocks are managed under the SESSF tier 4 HSF and assessed using standardised CPUE to determine RBCs. The 2008 rebuilding strategy for blue warehou was revised in 2014, with the aim to prevent targeted fishing for blue warehou, minimise incidental catches and improve knowledge of stock status. In September 2015, Shelf RAG noted range contraction and a lack of signs of recovery for the species. It also noted that current SESSF catches, even with low recruitment, should not be impeding recovery. Blue warehou remains classified as overfished because there is no evidence to suggest that the stock has rebuilt to above the limit reference point. Only 2 t was landed across both stocks in 2015–16. The deterioration of CPUE as an index of abundance is a concern for blue warehou. Despite catches being at record lows, the level of fishing mortality that will allow the stock to rebuild is unknown. A change in recruitment success and overall reproductive productivity could be an explanation for the failure to recover, but there is currently no mechanism to investigate whether this is the case. As a result, blue warehou is classified as uncertain with regard to the level of fishing mortality. Although there are a range of measures in place to ensure the UoA does not hinder recovery, the most recent evidence suggests range contraction of the stock and a lack of signs of recovery. Nevertheless, we note Shelf RAG’s conclusion that current catches should not be hindering recovery which is consistent with the medium risk SG. Eastern Gemfish Note: Because it is both a target species and an ETP species, Eastern Gemfish is assessed in P1 and here in P2 (i.e. Eastern gemfish would be considered an ETP species taken while targeting other target species assessed here). Eastern gemfish is currently assessed as overfished and uncertain fishing mortality (Georgeson et al. 2016). A stock recovery plan is in place (AFMA 2016) with an incidental TAC of 100 t that aims to prevent targeting and promote recovery of the stock to a level above PRI. Stock recovery is planned, monitored and evaluated through the SESSFRAG. The integrated stock assessment model for eastern gemfish was last updated in 2010 with data on catch and length frequency up to 2009 (Little & Rowling 2011). The 2010 estimate of spawning stock biomass was not substantially different from the 2008 or 2009 estimates. The base-case model estimated that the spawning stock biomass in 2009 was 15.6 per cent of the 1968 level. The 2010 assessment included projections of eastern gemfish biomass based on average historical recruitment that examined two catch scenarios: total catches of 100 t each year and zero catches each year. The projection for zero catch indicated that the point estimate of biomass might reach 0.2SB by 2017. Projections for annual catches of 100 t suggested recovery to 0.2SB by 2025 (Little & Rowling 2011). The model has not been updated since 2010 due to a paucity of useful additional datasets, however it has been regularly re-run using updates of the original data sources. While Georgeson et al. (2016) state that catches have been historically low in recent years, there have been no public data published since 2014 on total catch plus discards. Thus, while modelling projections suggest that the recent levels of total catch should result in recovery of the stock, the lack of recent data to demonstrate 1) that total catches have been below RBCs and 2) some recovery has occurred, means that this SI is currently assessed as precautionary high risk. Orange roughy Note: Because it is both a target species and an ETP species, Orange roughy is assessed in P1 and here in P2 (i.e. Orange roughy would be considered an ETP species taken while targeting other target species assessed here). Catches of orange roughy in the CTS are managed according to the Orange Roughy Rebuilding Strategy 2014 (ORRS) (AFMA, 2014h). The primary objective of this Strategy is to return all Orange Roughy stocks to levels where they can be harvested in an ecologically sustainable manner consistent with the Commonwealth Fisheries Harvest Strategy Policy 2007 (HSP) and ultimately maximise the economic returns to the Australian community. Management actions to minimise fishing mortality and support rebuilding include deepwater closures, targeted fishing for orange roughy stocks that are above the limit reference point of 20 per cent of the unfished spawning biomass, restricting of effort by limiting entry to existing fisheries, and ongoing research and monitoring to support stock assessments (Georgeson et al, 2016). The fishery is managed and assessed as a number of discrete regional management units: Cascade Plateau, eastern, southern and western orange roughy zones. Georgeson et al (2016) concluded that the Cascade Plateau and eastern Zone stocks were not overfished and not subject to overfishing, while the southern and western zones remained overfished but were not subject to overfishing. The Eastern Zone stock has recently recovered to levels above the LRP, and SlopeRAG considered that the southern and western zones may be showing some level of recovery in response to low TACs and RBCs of 0, it is likely that the known direct effects of the UoAs are not likely to hinder recovery. Other listed species On 29 January 2010, Longfin Mako (Isurus paucus), Shortfin Mako (Isurus oxyrinchus) and Porbeagle (Lamna nasus) sharks became EPBC Act ‘listed’ species after their inclusion on Appendix ii of the Convention of Migratory Species (CMS); of these, Shortfin Mako and Porbeagle sharks are caught in the SESSF. Walker & Gason (2007) reported rapid assessments for shark species interacting with the SESSF, and reported Shortfin mako as a high risk and Porbeagle as medium risk. Mako sharks Walker & Gason (2007) estimated 2359 kg of Shortfin Mako is caught annually by the SESSF, of which 1124 kg is taken by the otter-trawl operations and 98% is retained. Relative to catches of mako sharks from other fisheries, it is likely that the CTS is not hindering the recovery of these species. Porbeagle Only 130 kg of Porbeagle is caught annually in the SESSF, and all is caught by the longline sector. Therefore, it is highly likely that the CTS is not hindering the recovery of this species. Scoring Blue grenadier, blue eye trevalla and the pink ling – eastern stock are scored precautionary high risk against this PI as a result of possible interactions with the eastern gemfish stock. The remaining stocks are scored medium risk because they are unlikely to interact with the eastern gemfish stock. |
||||
|
CRITERIA: (ii) The UoA has in place precautionary management strategies designed to:
Also, the UoA regularly reviews and implements measures, as appropriate, to minimise the mortality of ETP species |
||||
|
(a) Management strategy in place |
LOW RISK |
|||
|
The fishery has a comprehensive strategy in place to monitor, assess and manage its impact on ETP species including:
Species-specific management strategies: ‘Conservation dependent’ species Fishing restrictions have been imposed on all overfished stocks listed under the EPBC Act as ‘conservation dependent’. These restrictions are to promote the rebuilding of the stock to a level above the target reference limit within an allocated timeframe. AFMA develops stock rebuilding strategies in consultation with the fishing industry, the Department of the Environment, the Department of Agriculture and the relevant management advisory committee and resource assessment group. Rebuilding strategies are reviewed every five years to monitor the progress of rebuilding and ensure the continued effectiveness of management arrangements which have been implemented. Specific management plans have been compiled for the following ETP species[3]:
Seals SEDs have been compulsory for freezer boats in this component of the SESSF since 2005, and modifications to fishing practices seem to have substantially reduced the incidence of seal bycatch in the midwater nets of factory vessels (Georgeson et al, 2016). Trials of SEDs in the wet-boat sector have achieved positive results (Knuckey 2009), and industry has adopted a code of conduct that includes voluntary measures to minimize interactions. Seal bycatch (alive or dead) must be formally reported to SEWPaC and AFMA within 24 hours of the time of capture. Georgeson et al (2016) report that “trials of a flexible SED design suitable for use in smaller nets have been reasonably successful (Knuckey 2009), but reliably estimating and reducing the level of interactions between seals and wet-boats remain difficult. A trial using a shortened codend to reduce seal bycatch was completed in late 2014. The trial found no definitive proof that short trawl nets had lower interaction rates with seals, caught fewer seals or resulted in lower mortality rates of caught seals (Koopman et al. 2014).” Logbook reporting of pinniped interactions has improved markedly over the past three years, but comparison with observer data suggests that there is still some level of under-reporting (Georgeson et al, 2016). Seabirds In response to the detection of seabird interactions with trawl gear in the SET and GAB sectors of the SESSF, AFMA has worked in conjunction with industry and seabird experts to develop and implement Seabird Management Plans (SMPs) on all SESSF otter board trawl vessels (Georgeson et al, 2016b). Australian trawl fisheries have introduced seabird management plans in the Great Australian Bight Trawl and Commonwealth Trawl Sector of the Southern and Eastern Shark and Scalefish Fishery in 2011. Seabird management plans are tailored to individual fishing boats and identify the main threats posed to seabirds by that boat. Each plan identifies the physical mitigation measures to stop seabirds from interacting with the warp wires and other fishing gear. They also include measures dealing with the discharge of biological waste from vessels to reduce seabird attraction and interaction. Further ‘common-sense’ measures are employed by fishers to help reduce the risk of interactions, including reducing the time the nets are on the surface of the water and cleaning the net of fish when re-setting. This reduces the likelihood of seabirds using the nets as a food source and consequently getting entangled. Seabird Management Plans set out a variety of proven mitigation measures that are tailored to each vessel in each fishery. Trawl fishers must use ‘warp deflectors’ or pinkie devices. These are pink buoys that sit alongside the trawl gear as a visual deterrent. The buoys also act as a physical barrier between birds and fishing gear. Recently, SETFIA led a research project to trial other alternative seabird mitigation devices, which resulted in sea trials for two new devices: water sprayers and bird bafflers (Boag 2016). Sprayers were found to reduce interactions by 92% while bafflers reduced interactions by 96%. AFMA have approved both approaches for use as seabird mitigation devices within vessels’ seabird management plan (as a condition on the fishing permit). From 1 May 2017, all CTS trawl vessels must use one of these two devices or continue with pinkies and not discharge offal while towing. As it is not economical to retain offal, it is probably reasonable to assume that from May 2017 seabird interactions in the CTS will likely be reduced by a minimum of 90% from initial levels. SETFIA have also recently introduced a Code of Conduct and an E-Learning programme to attempt to improve seabird avoidance measures and seabird interaction reporting. |
||||
|
(b) Management strategy implementation |
MEDIUM RISK |
|||
|
There is an objective basis for confidence for some species groups (e.g. orange roughy biomass estimates; mitigation approaches for seals and seabirds has followed international best practice approaches) that the management measures are likely to work, however in the case of Eastern gemfish and blue warehou, there is currently insufficient evidence to suggest that the strategy is being implemented successfully. As such this criterion is assessed as medium risk on the basis that a plausible argument exists that the measures are likely to work.
|
||||
|
CRITERIA: (iii) Relevant information is collected to support the management of UoA impacts on ETP species, including:
|
||||
|
(a) Information |
LOW RISK |
|||
|
There is substantial quantitative information on all ETP interactions to ensure an adequate assessment of fishery-related mortality and to support the strategy to manage impacts on ETP species. All ETP species identified through the ERA process (as occurring in the area of the fishery) have been included in the priority list for each fishery within the Ecological Risk Management (ERM). Many of the identified species are also managed under various national plans of action. Those applicable to the Otter Trawl sub-fishery include the:
Operators are also required to report all interactions with ETP species in daily logbooks, and to carry an independent observer upon request by AFMA. In 2015/16, observer coverage in the otter-trawl sub-fishery of the CTS was 144 days. Although the ISMP was not developed to evaluate ETP species interaction, ISMP data has been used to validate logbook data. In regard to ETP species, SESSF fishers are required to recorded wildlife interactions on shot by shot scientific logbooks. The following information is collected on protected species:
A summary of interactions with commonwealth fisheries is available online at: http://www.afma.gov.au/environment/eco_based/reporting.htm#reports. Retained species assessed here under ETP have stock assessments undertaken on a regular basis. These estimates of stock status provide a meaningful measure of where the biomass is relative to accepted reference points, and also provide a means to tracking stock recovery. Fishing operators are able to use AFMA approved electronic monitoring equipment to meet the 100 per cent observer requirements when fishing the Australian Sea Lion Management Zone and Dolphin Observation Zone off South Australia. As 100 per cent monitoring coverage is a condition of fishing in these zones, operators must keep their electronic monitoring equipment operating at all times when fishing in, or transiting through these zones. To assist fishers accurately identify protected species, AFMA has produced a protected species identification guide and a seabird identification guide. Accordingly, there is quantitative information available which is adequate to assess the UoA related mortality and to support strategies to manage impacts. |
||||
|
PI SCORE |
MEDIUM RISK – Orange roughy – Cascade, Orange roughy – Eastern, Gemfish – Eastern and Western, Pink ling – Western |
|||
|
PRECAUTIONARY HIGH RISK – Blue grenadier, Blue eye trevalla, Pink ling – eastern stock |
||||
|
CRITERIA: (i) The UoA does not cause serious or irreversible harm to habitat structure and function, considered on the basis of the area(s) covered by the governance body(s) responsible for fisheries management |
||||||
|
(a) Habitat status |
LOW RISK |
|||||
|
Demersal otter-trawl gear is considered a potentially highly damaging gear-type, and the detrimental effect on habitat structure that comes into contact with trawl gear is well documented (e.g. Kaiser et al. 2006; Althaus et al. 2009, Williams et al. 2010; Clark et al. 2012). Recent modelling of the spatial extent of effort in the CTS suggests the fishery has a relatively small footprint across the South East Marine Region shelf and slope areas. Pitcher et al (2015) modelled the effects of fishing for 15 spatially unique species assemblages and 10 habitat forming benthos taxa types that had been predicted and mapped from survey data. They reported that:
Overall, they reported that around 6% of the shelf and slope area was exposed to trawl effort annually, with around 23% of the SEMR region exposed across the life of the study (Table 2). Of the habitat forming tax types, the maximum level of exposure was 9%.
Table 2: Inclusion of benthic biodiversity in CMRs and fishery closures, and exposure to human uses (Pitcher et al, 2015)
Based on this it appears highly unlikely that the UoA will reduce habitat structure and function to the point of serious or irreversible harm. We also note that the MSC assessment for the blue grenadier sub-fishery of the CTS (SCS 2013) assessed habitat status as a score of SG80, but it must be noted that this fishery is predominately mid-water trawl with only a small component of benthic otter trawl. In summarising the available habitat information SCS (2013) stated: “There is good understanding of the main habitat types in the area of the fishery and information is available to broadly understand the main impacts of the gear. However, there is limited new information available on the marine habitat structure on a scale relevant to the fishery. Demersal trawl fishing is generally not expected to cause serious or irreversible harm to any habitats although concerns remain about the impacts on the upper slope areas (200 to 700m deep) where much of the fishing is concentrated. Current closed areas are comprehensive, adequate and representative such that serious or irreversible harm is not expected on a broad regional scale.” |
||||||
|
CRITERIA: (ii) There is a strategy in place that is designed to ensure the UoA does not pose a risk of serious or irreversible harm to the habitats. |
||||||
|
(a) Management strategy in place |
LOW RISK |
|||||
|
The measures in place to manage impacts of trawling on habitats in the CTS area include:
Spatial closures Approximately 86 per cent of trawl grounds have been closed within the CTS, including large areas of Bass Strait and coastal areas in South Australia (Figure 11). Trawling that does occur tends to be over grounds that have been trawled historically, i.e. the trawling footprint is not expanding (AFMA, 2015e). Closures have been introduced for a range of reasons including the protection of depleted species (Table 2 and Table 3), however all will serve to limit the direct impact of trawling on benthic habitats.
Figure 11: Spatial closures within the Commonwealth Trawl Sector area (AFMA, 2015e)
Table 2: Closures relevant to the CTS under the Upper Slope Dogfish Management Strategy (AFMA, 2015d)
Table 3: Spatial closures which have implemented to protect ETP and high risk species in the CTS (AFMA, 2014d)
In addition to closures under fisheries legislation, in 2007 a network of 14 marine protected areas was declared in the South-east marine region (Figure 12). The South-east Commonwealth Marine Reserves Network stretches from the south coast of New South Wales, around Tasmania and Victoria and west to Kangaroo Island off the South Australian Coast. The reserves cover an area of 388,464 km2 with a depth range of 40m – 4600m. The reserves include a range of ecosystems, habitats and biological communities. The zoning within the South-east network does not permit otter trawling. The magnitude and placement of the marine park network does provide some permanent protection to representative samples of marine habitats within the area of the fishery.
Figure 12: Commonwealth south east region marine reserve network[4]. ERAs/ERM AFMA has undertaken detailed ecological risk assessments (ERAs) for all major Commonwealth managed fisheries as a key part of the implementation of the ecological component of Ecologically Sustainable Development (ESD). ERAs assess the risks that fishing poses to the ecological sustainability of the marine environment by considering the impact of fishing on all components of the marine environment, including risks to habitats. The main purpose of ERAs is to prioritise the management, research, data collection and monitoring needs for each fishery. The fishery has been subjected to Level 1 and Level 2 risk assessments for habitats (Wayte et al. 2007). Hobday et al. (2011) provide a framework to move habitat assessment toward Level 3 assessments, including a Level 2 residual risk assessment, which will move the process from the ERA to the Ecological Risk Management (ERM) framework. Together, these measures and the ongoing ERA process are likely to be considered at least a partial strategy to ensure the UoAs do not cause serious and irreversible harm to habitats. |
||||||
|
(b) Management strategy implementation |
LOW RISK |
|||||
|
The work of Pitcher et al (2015) provides some objective basis that the strategy will work, and some quantitative evidence that the strategy is being implemented successfully. |
||||||
|
CRITERIA: (iii) Information is adequate to determine the risk posed to the habitat by the UoA and the effectiveness of the strategy to manage impacts on the habitat. |
||||||
|
(a) Information quality |
LOW RISK |
|||||
|
There are considerable data on the nature, distribution and vulnerability of the main habitats of the CTS. Habitat information in the SESSF has been collected by Bax & Williams (2001) and Williams et al. (2006), the latter report integrating fisher knowledge with scientific data to provide an assessment of 516 “fishing grounds”. The ERA process (Wayte et al. 2007) identified and ranked risks to 156 separate habitats in the fished area. Spatial closures include the Commonwealth Marine Reserve Network and fishery-specific spatial closures. All trawl tracks are recorded by VMS. More recently, Pitcher et al (2015) examined the spatial extent of the fishery in relation to unique assemblages and habitat forming taxa. These data are relevant to the scale and intensity of the fishery and as such this criterion is assessed as low risk. |
||||||
|
(b) Information and monitoring adequacy |
LOW RISK |
|||||
|
Information is broadly adequate to understand the main impacts of gear on the main habitats and this has been assessed through the ERA process (Wayte et al, 2007). There is also reliable information on the spatial extent of interaction through VMS records. Pitcher et al’s (2015) analysis provides information on the spatial overlap of trawl effort with vulnerable habitat types. As a result, we have scored this SI low risk. |
||||||
|
PI SCORE |
LOW RISK |
|||||
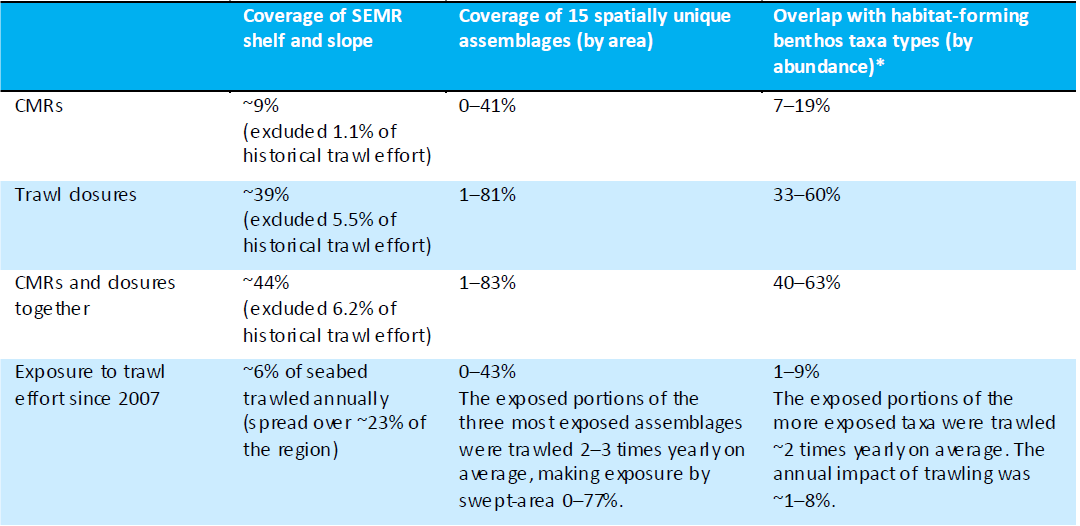
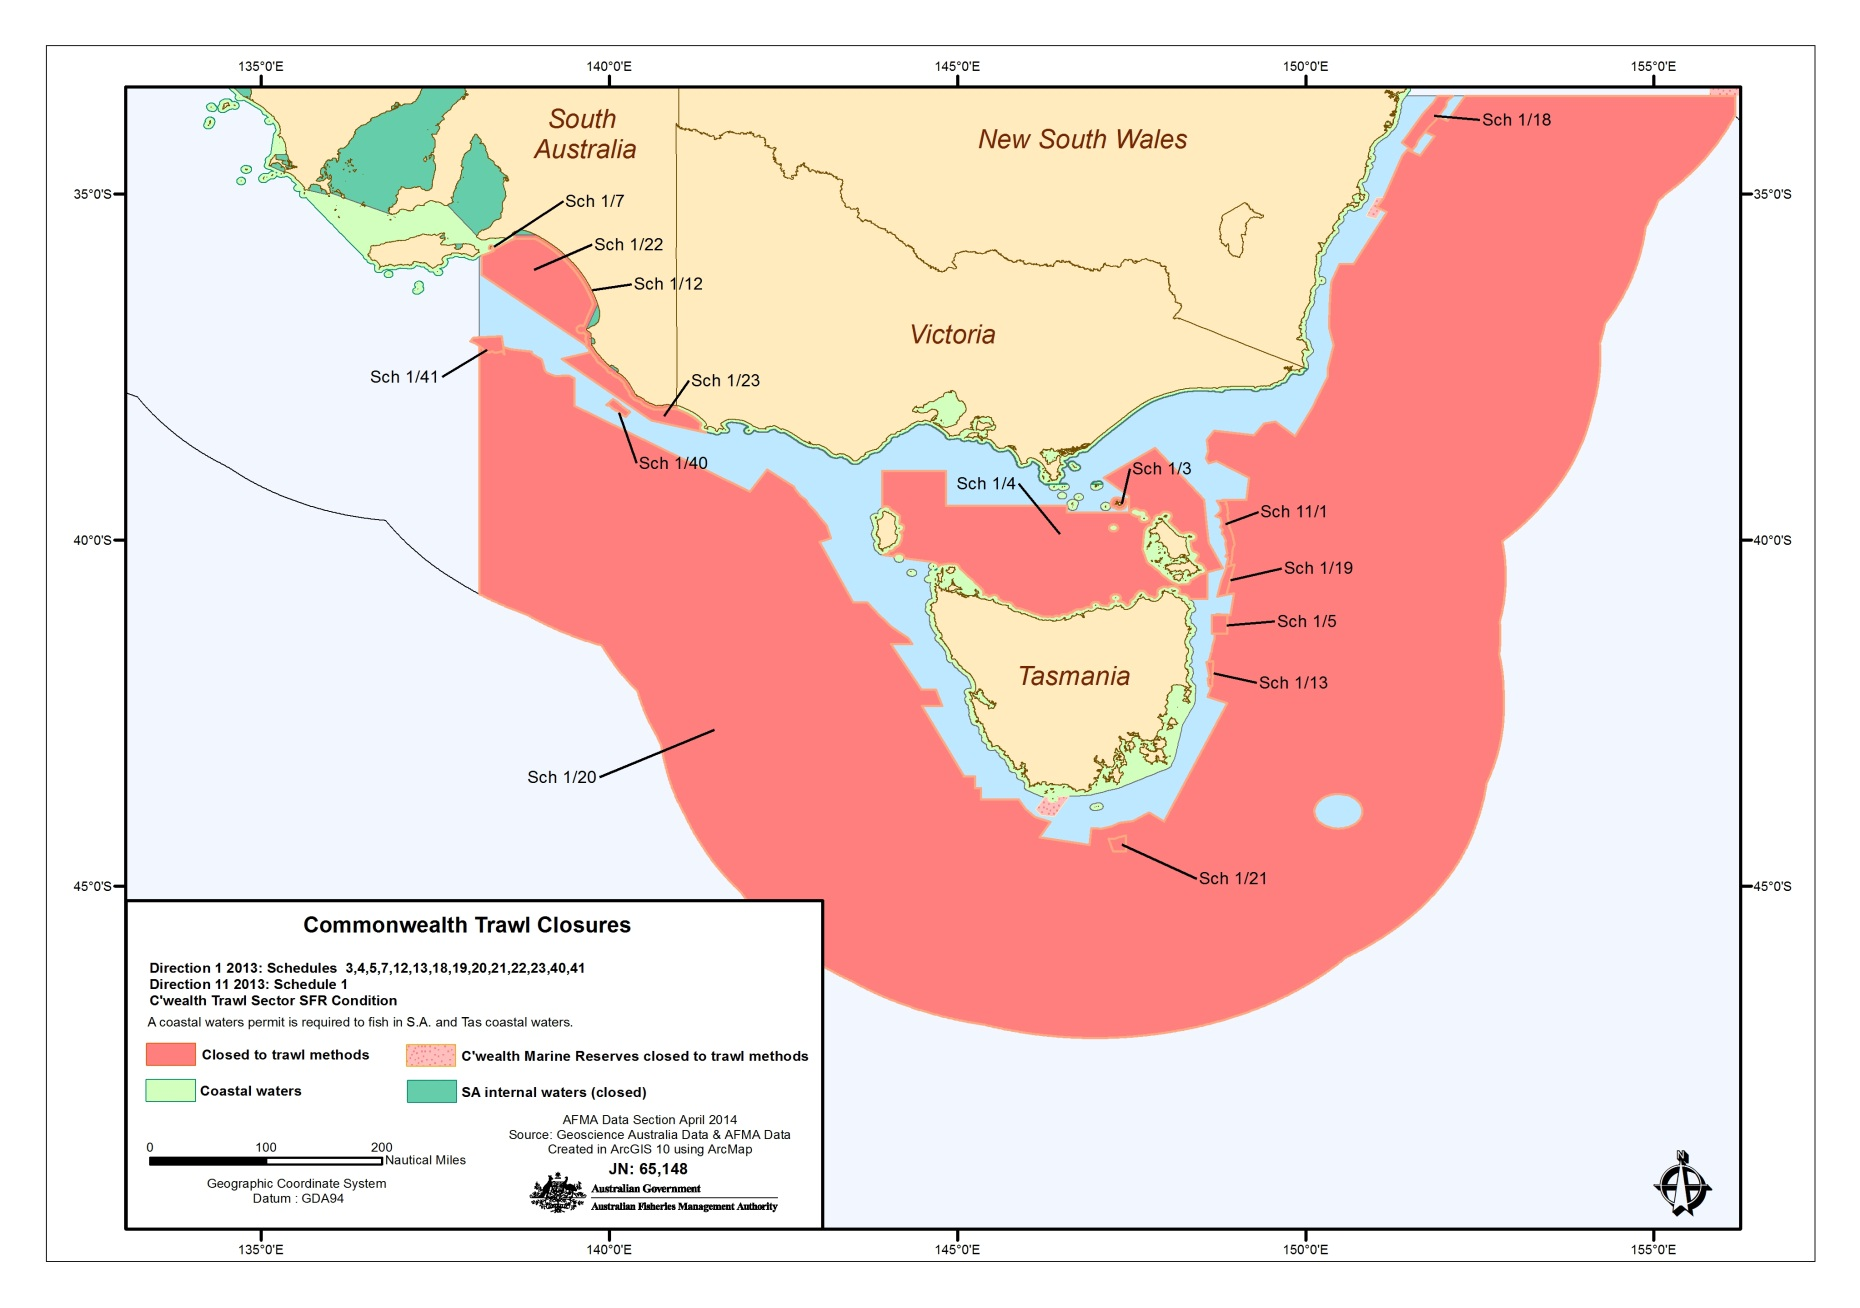
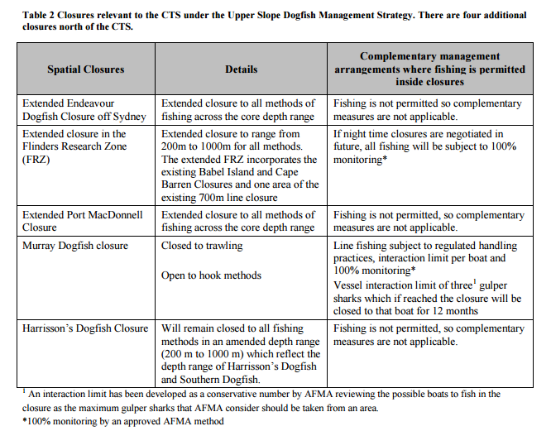
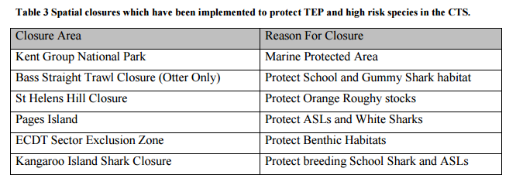
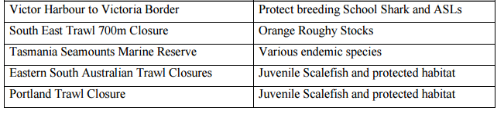
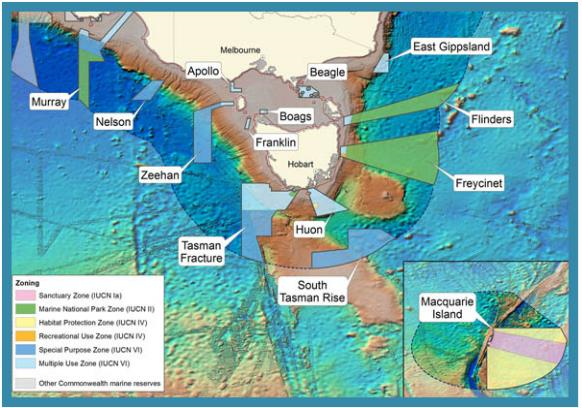
|
CRITERIA: (i) The UoA does not cause serious or irreversible harm to the key elements of ecosystem structure and function. |
|||||
|
(i)(a) Ecosystem Status |
LOW RISK |
||||
|
Serious or irreversible harm in the ecosystem context should be interpreted in relation to the capacity of the ecosystem to deliver ecosystem services (MSC, 2014). Examples include trophic cascades, severely truncated size composition of the ecological community, gross changes in species diversity of the ecological community, or changes in genetic diversity of species caused by selective fishing. The risks that the SESSF poses to the sustainability of the marine ecosystems in which it operates have been investigated through the AFMA ERA process involving:
In the case of the SESSF, residual risk assessment guidelines have also been applied to the outcomes of the Level 3 SAFE assessment. The ERAEF is employed for all elements of the fishery including species (target, byproduct, discard and ETP), habitats and ecosystems. Wayte et al. (2007) assessed the following number of ecological units for the CTS fishery: 28 target, 95 by-product, 276 discard, 201 ETP, 158 habitat and 33 community. For the CTS, 600 species in total were assessed at the Level 2 (Productivity and Susceptibility Analysis; PSA) stage. Of these 600, 159 species were classified as high risk; the majority of the high-risk species were chondrichthyans or teleosts. The Level 3 SAFE reduced the number of high-risk species to 23. During the residual risk process, new information was identified that allowed the total number of high-risk species to be reduced to 10. These species include several low-productivity, deepwater sharks, several seabirds and the Australian fur seal. The SAFE assessment was re-evaluated in 2012 (Zhou et al. 2012) and additional species were included as high risk for further examination. Residual risk assessment guidelines were applied to the outcomes of the updated SAFE assessment in 2014 to arrive at a final list of 11 species deemed to be at either high or precautionary high risk which require treatment in the SESSF ERM Strategy 2015. These processes provide some confidence that the fishery is not causing serious or irreversible harm to these elements of the ecosystem. The original ERA (Wayte et al. 2007) did not address community units at the Level 2 PSA. Hobday et al. (2011) aimed to “complete the development of the ERAEF Level communities (ecosystems) approach”. The key outcomes from this FRDC project with regard to ecosystem status were described by following excerpt from Hobday et al. (2011): “a set of attributes that represent the productivity and susceptibility of an ecological community were determined by and a scoring system for these attributes devised. The methods were then tested on the CTS. A set of 27 benthic communities were identified, and each one scored using the five productivity attributes and seven susceptibility attributes for potential risk as a result of the CTS. A total of six communities were identified as potential high risk, including two off Western Tasmania, and one off south-east Victoria. Overall, the results for the SESSF case study showed that the communities that might be intuitively considered to be at higher risk due to known fishing patterns, such as the South Eastern 110-250m (general concentration of effort) and the Western Tasmanian Transition 250-565m (targeting of certain species such as spotted trevalla [warehou]), were also ranked as high risk in the community PSA. Targeting of blue grenadier and orange roughy (and high reported catches) in the deeper Tasmanian communities resulted in only medium risk to the communities in this assessment. Communities where fishery effort was relatively low were generally ranked as low to medium risk.” The assessment of risks from fishing at the community level have not passed beyond these published results. An ecosystem model termed “Atlantis” has also been developed for the fishery (Fulton et al. 2007). While the model has been used for MSE evaluations, its capacity to deliver outputs that help to define the status of the ecosystems in South-East Australia is limited (Fulton et al. 2007). Although neither the ecosystem model nor the ERAEF process provide direct evidence that the fishery is not affecting the ecosystem, there is sufficient knowledge of the key elements of the ecosystem that when considered in combination with the management measures in place (significant spatial closures, reductions of 60% in trawl effort, and gear limitations including legislated bycatch exclusion devices) and the largely positive stock status of the main target species, provide sufficient confidence that the CTS is highly unlikely to disrupt the key elements underlying ecosystem structure and function to a point where there would be a serious or irreversible harm. |
|||||
|
CRITERIA: (ii) There are measures in place to ensure the UoA does not pose a risk of serious or irreversible harm to ecosystem structure and function. |
|||||
|
(a) Management Strategy in place |
LOW RISK |
||||
|
The fishery has in place measures that can be considered at least a partial strategy to ensure that the fishery does not impact on the ecosystem to cause serious and irreversible harm. The strategy is underpinned by harvest strategies which aim to maintain targeted stocks at levels higher than that consistent with MSY and the ERA framework which assesses all the key elements of the ecosystem as described previously. Key impacts on species have been assessed to the Level 3 stage, with outcomes documented through the various risk assessment reports culminating in the SESSF ERM Strategy (AFMA, 2015e), with actions being implemented through the Bycatch and Discard Workplan (AFMA 2014d). Hobday et al. (2011) documented the first Level 2 community assessment for a Commonwealth fishery using the CTS as a case study. To action the risks identified through the ERA process, AFMA and industry have developed various implementation strategies including:
|
|||||
|
(b) Management Strategy implementation |
LOW RISK |
||||
|
The extensive assessment and treatment of ecological impacts through the ERA/ERM process, stock assessment and modelling results for the main target species, which form the bulk of the overall catch and are largely in positive positions against reference points, successful measures to recover overfished species (e.g. orange roughy eastern zone) and minimize impacts of ETP species (e.g. SEDs), together with habitat modelling showing the fishery is likely to cover ~6% of the slope and shelf area of the SEMR annually provide some objective basis for confidence that the UoA that the partial strategy will work and some quantitative evidence that the measures are being implemented successfully. |
|||||
|
CRITERIA: (iii) There is adequate knowledge of the impacts of the UoA on the ecosystem. |
|||||
|
(a) Information quality |
LOW RISK |
||||
|
There has been significant investment in research for the fishery in all elements of the ecosystem, including species (target, byproduct, ETP), habitats and ecosystems. While these information sources vary in detail and progression of knowledge, they have been collected in a manner that provides a sound understanding of these key ecosystem elements and allows for detection of changes in risk. Critical data sources include but are not limited to: catch and effort logbooks, VMS data, observer data, fishery-independent survey data, and habitat mapping data. |
|||||
|
(b) Investigations of UoA impacts |
LOW RISK |
||||
|
The main impacts of the UoA on the ecosystem are well understood and most of them have been studied in significant detail. Target species are assessed and quotas determined on an annual basis. Impacts on bycatch species have been evaluated through the ERA process utilising data from various studies that provide fishery-dependent and fishery-independent data sources (e.g. Zhou et al 2012). ETP species have been studied extensively through the ERA process and species specific research programs (e.g. Kirkwoood et al. 2010). Habitats have been examined thoroughly through several studies (e.g. Bax & Williams 2001, Williams et al. 2006, Wayte et al. 2007; Pitcher et al, 2015). Ecosystem impacts have been examined through the Atlantis model, albeit that the interpretation of results was limited to Management Strategy Evaluations (Fulton et al 2007). This is sufficient to assess this criterion as low risk. |
|||||
|
PI SCORE |
LOW RISK |
||||
COMPONENT 3: Effective management
|
CRITERIA: (i) The management system exists within an appropriate and effective legal and/or customary framework which ensures that it:
|
||||
|
(a) Compatibility of laws or standards with effective management |
LOW RISK |
|||
|
Relevant Australian Commonwealth Acts, subsidiary legislation and cooperative instruments, including the EPBC Act 1999, Fisheries Management Act (FMA), Fisheries Administration Act (FAA) provide an effective legal framework for the purposes of delivering management outcomes consistent with MSC Principles 1 and 2. The FMA takes account of the United Nations Fish Stocks Agreement and FAO’s Code of Conduct for Responsible Fisheries. |
||||
|
(b) Respect for Rights |
LOW RISK |
|||
|
The management system has a mechanism to formally commit to the legal rights created explicitly or established by custom on people dependent on fishing for food and livelihood. The Commonwealth Native Title Act 1993 formally commits to the rights of indigenous people who can demonstrate their customary rights to fish in a particular area. This legislation provides a mechanism for the making of binding decisions about native title rights to areas of land and water and thereby ensures access to fish resources for people who depend on fishing for their food. AFMA’s jurisdiction typically begins three nautical miles offshore, thus, there is usually no overlap between Commonwealth commercial fishing and customary fishing activity. However, for some fisheries, consideration of customary fishing is largely made through interaction between AFMA’s management and the Native Title Act 1993. Where AFMA modifies an act, a direction or other legislative instrument in a way that may affect native title, that change triggers the ‘future act’ provision of the Native Title Act 1993. In situations where a future act provision could possibly be triggered, AFMA provides the opportunity for relevant native title bodies to be consulted and provide comment. Given the above, the management system has a mechanism to observe the legal rights created explicitly or established by custom of people dependent on fishing for food or livelihood. |
||||
|
CRITERIA: (ii) The management system has effective consultation processes that are open to interested and affected parties. The roles and responsibilities of organisations and individuals who are involved in the management process are clear and understood by all relevant parties. |
||||
|
(a) Roles and Responsibilities |
LOW RISK |
|||
|
The roles and responsibilities of the main people (e.g. Fisheries Minister, AFMA Commissioners) and organisations (AFMA) involved in the Australian Commonwealth fisheries management process are well-understood, with relationships and key powers explicitly defined in legislation (e.g. FMA, FAA) or relevant policy statements (e.g. AFMA Fisheries Management Paper 1 – Management Advisory Committees). |
||||
|
(b) Consultation Process |
LOW RISK |
|||
|
The management system includes consultation processes that regularly seek and accept relevant information, including local knowledge. The management system demonstrates consideration of the information and explains how it is used or not used. Resource assessment groups (RAGs) are the bodies responsible for providing scientific advice to the management advisory committees (MACs) and the AFMA Commission on the status of fish stocks, sub-stocks, species (target and non-target), and the impact of fishing on the marine environment. They coordinate, evaluate and regularly undertake fishery assessments, and provide recommendations on issues such as the setting of total allowable catches, stock rebuilding targets, and biological reference points. Membership of the RAGs comprises representatives from the areas of fisheries management, research, industry, fisheries economics and conservation. The broad membership ensures that, in addition to scientific information on each fish stock, industry knowledge and developments in management strategies, market prices and the costs of harvesting are also taken into account. MACs are the main advisory bodies to AFMA. They provide advice on a variety of issues including fisheries management arrangements, research, and compliance/management costs. The MACs also provide a link between AFMA and those with an interest in the fishery, with membership generally comprising members from commercial industry, fisheries management, the scientific community, the environment/conservation sector and, in some instances, the State governments. Under the FMA, ‘plans of management’, or fisheries management plans (FMPs) as they are known, are the way arrangements are set for each fishery. The FMA requires consultation with the public on draft FMPs and provides for ministerial oversight. Under the Act AFMA must set out in writing a FMP for each fishery or, likewise in writing, explain why one is not needed and provide draft plans for public display so interested persons can make representations. |
||||
|
CRITERIA: (iii) The management policy has clear long-term objectives to guide decision making that are consistent with MSC fisheries standard, and incorporates the precautionary approach. |
||||
|
(a) Objectives |
LOW RISK |
|||
|
The long term objectives of the management system are specified in the FMA and the EPBC Act, and further defined in the Commonwealth Fisheries Harvest Strategy Policy and Guidelines. The objectives and policy guidance are consistent with (MSC’s Principles and Criterion) and explicitly require application of the precautionary principle. The fishery is also subject to the Commonwealth EPBC Act which requires periodic assessment against the Guidelines for the Ecologically Sustainable Management of Fisheries. These Guidelines are consistent with the MSC Principles and encourage practical application of the ecosystem approach to fisheries management. |
||||
|
PI SCORE |
LOW RISK |
|||
|
3B: Fishery Specific Management System |
||||||
|
CRITERIA: (i) The fishery specific management system has clear, specific objectives designed to achieve the outcomes expressed by MSC’s Principles 1 and 2. |
||||||
|
(a) Objectives |
LOW RISK |
|||||
|
Well defined and measurable short and long term objectives, which are demonstrably consistent with achieving the outcomes expressed by MSC’s Principles 1 and 2, are explicit within the fishery’s management system. The SESSF Management Plan 2003 (amended in 2009) reinforces the objectives of the FMA as the objectives of the Plan. These are consistent with Australia’s obligations under international arrangements, national legislation and specifically require application of the precautionary principle. Fishery specific objectives can be identified in the Harvest Strategy. |
||||||
|
CRITERIA: (ii) The fishery specific management system includes effective decision making processes that result in measures and strategies to achieve the objectives and has an appropriate approach to actual disputes in the fishery. |
||||||
|
(a) Decision making |
LOW RISK |
|||||
|
Australia’s Commonwealth fisheries decision making process is well established and set out explicitly in relevant legislation (e.g. FMA, FAA) and policy documents (e.g. Looking to the Future, Commonwealth Harvest Strategy Policy). The decision making processes by AFMA based on advice from SEMAC, working with SESSFRAG, are transparent with feedback provided by the Commission directly to SEMAC and to stakeholders through media such as the regular AFMA Update and through the Annual public meeting of both the MAC and AFMA. There are numerous examples in the last decade of the CTA management system responding to serious and other matters (e.g. TACC adjustments based on the harvest strategy, ERM reports based on the outcomes of ERAs, deepwater shark closures etc). |
||||||
|
(b) Use of the Precautionary approach |
LOW RISK |
|||||
|
The objectives and policy guidance of the SESSF explicitly require application of the precautionary principle. The fishery is also subject to the Commonwealth EPBC Act, which requires periodic assessment against the Guidelines for the Ecologically Sustainable Management of Fisheries (for export approval). These Guidelines encourage practical application of the ecosystem approach to fisheries management. The ERA methodology also accounts for uncertainty by being precautionary. |
||||||
|
(c) Accountability and Transparency |
LOW RISK |
|||||
|
The AFMA website contains an extensive list of evaluations, research reports and assessments, and evidence exists within the SEMAC and the RAG that decisions respond to these findings. South East MAC (SEMAC) meeting minutes are also available online[5]. AFMA provide monthly and annual reports, which outline program outcomes and, provide a means for measuring success. |
||||||
|
CRITERIA: (iii) Monitoring, control and surveillance mechanisms ensure the management measures in the fishery are enforced and complied with. |
||||||
|
(a) MCS Implementation |
LOW RISK |
|||||
|
AFMA’s framework for its National (Domestic) Compliance and Enforcement Program is set out in the AFMA National Compliance Operations and Enforcement Policy (AFMA, 2015f). The policy is compliant with the Australian Fisheries National Compliance Strategy 2010-15 and aims to “effectively deter illegal fishing in Commonwealth fisheries and the Australian Fishing Zone”. Compliance activities are informed by risk assessments undertaken in accordance with the international standard for risk management (ISO 31000:2009) across all major Commonwealth domestic fisheries (AFMA, 2015f). Compliance operations are supported through a centralised structure with separate Intelligence, Planning and Operations units. More specific annual compliance priorities and risk treatments are set out in AFMA’s National Compliance and Enforcement Program 2016 -17 (AFMA, 2015g). Key priorities for 2016-17 include (i) failure to have a Vessel Monitoring System (VMS) or Electronic Monitoring (emonitoring) system operating at all times, (ii) quota evasion and (iii) bycatch mishandling, which has been identified as an emerging risk. Risks are treated through a program of general deterrence (i.e. inspections and patrols designed to target identified high risk ports, boats and fish receivers), and other targeted measures – e.g. physical and technical surveillance, standard investigative activity, intelligence gathering, and media strategies. Compliance Risk Management Teams (CRMTs) may be formed to help address priority risks (e.g. VMS/electronic monitoring offences; quota evasion). These measures constitute a system which has demonstrated an ability to enforce management measures. |
||||||
|
(b) Sanctions and Compliance |
LOW RISK |
|||||
|
A framework of sanctions for non-compliance is set out in the FMA, Maritime Powers Act 2013 and Fisheries Management Regulations 1992. These include powers to issue warnings, cautions, directions, Observer Compliance Notices, Commonwealth Fisheries Infringement Notices (CFINs), amend fishing concession conditions, suspend or cancel fishing concessions and prosecute offenders through the courts (AFMA, 2015f). Some evidence exists that fishers comply with the management system including providing information of importance to the effective management of the fishery. Across all years between 2011-12 and 2015-16, no action was required in >90% of boat inspections in Commonwealth fisheries (total inspections 879) (AFMA, 2015g). |
||||||
|
LOW RISK |
||||||
|
A 2013 audit of the management of the AFMA Domestic Compliance system did not highlight systematic non-compliance (ANAO, 2013). |
||||||
|
CRITERIA: (iv) There is a system for monitoring and evaluating the performance of the fishery specific management system against its objectives. |
||||||
|
(a) Evaluation coverage |
LOW RISK |
|||||
|
Performance of all stocks against the SESSF Harvest Strategy are assessed annually through the RAG and MAC process. TACs are adjusted annually based on updated stock assessments and RAG/MAC/AFMA advice. Periodic updates of ERAs evaluate performance against environmental objectives and guide management priorities. Fishery Status Reports produced annually by the Australian Bureau of Agricultural and Resource Economics and Sciences (ABARES) provide an independent evaluation of key parts of the management system (e.g. stock status, overfishing status). In addition, two Australian National Audit Office reviews have been undertaken into the domestic compliance program (2009, 2013). Accordingly, the fishery has measures in place to evaluate key parts of the management system. |
||||||
|
(b) Internal and/or external review |
LOW RISK |
|||||
|
The fishery-specific management system is subject to regular internal review through the SEMAC process, which tracks performance of the fishery against the objectives in the Management Plan. AFMA is also required to report in its Annual Report on overall performance against the legislative objectives, statutory requirements and financial reporting, the effectiveness of internal controls and adequacy of the Authority’s risk management processes. The fishery is subject to regular external assessment through the ongoing assessment for export approval under the EPBC Act against the Guidelines for the Ecologically Sustainable Management of Fisheries. Moreover, ABARES reports on the ecological and economic sustainability of fisheries managed by AFMA and the Australian National Audit Office undertakes periodic reviews of aspects of AFMA’s performance (e.g. ANAO, 2013). |
||||||
|
PI SCORE |
LOW RISK |
|||||
AFMA (2009) SESSF Stock Assessment Methods and TAC Setting Process. Version 1.5. September 2009. 8 p
AFMA (2012), ‘Residual Risk Assessment of the Level 2 Ecological Risk Assessment – Non Teleost and Non-Chondrichthyan Species. Report for the Otter Board Trawl Method of the Commonwealth Trawl Sector Fishery, July 2012’. Australian Fisheries Management Authority, Canberra, Australia.
AFMA (2012b). Upper-Slope Dogfish Management Strategy – AFMA-Managed Fisheries. Australian Fisheries Management Authority, October 2012.
AFMA (2014a). Southern and Eastern Scalefish and Shark Fishery management arrangements booklet May 2014, AFMA, Canberra.
AFMA (2014b). Orange Roughy (Hoplostethus atlanticus) Stock Rebuilding Strategy
AFMA (2014c). ‘Residual Risk Assessment – Teleost and Chondrichthyan Species. Report for the Otter Board Trawl Method of the Commonwealth Trawl Sector. July 2014’. Australian Fisheries Management Authority, Canberra, Australia.
AFMA (2014d) Commonwealth Trawl Sector (Otter Board Trawl & Danish Seine), BYCATCH AND DISCARDING WORKPLAN 2014 – 2016
AFMA (2014e) School Shark (Galeorhinus galeus) Stock Rebuilding Strategy Revised 2014. Available from http://www.afma.gov.au/have-your-say-school-shark-rebuilding-strategy/ Accessed 9 April 2015.
AFMA (2015a). Harvest Strategy Framework for the Southern and Eastern Scalefish and Shark Fishery 2009 Amended (February 2015).
AFMA (2015b). Orange roughy (Hoplostethus atlanticus) stock rebuilding strategy 2014, Australian Fisheries Management Authority, Canberra.
AFMA (2015c). Eastern Gemfish Stock Rebuilding Strategy 2015.
AFMA (2015d). Species Summaries for the Southern and Eastern Scalefish and Shark Fishery for stock assessments completed in 2015 in preparation for the 2016-17 fishing season.
AFMA (2015e). Ecological Risk Management Strategy for the Southern and Eastern Scalefish and Shark Fishery.
AFMA (2015f). National Compliance and Enforcement Policy 2015. 31pp.
AFMA (2015g). National Compliance and Enforcement Program 2016 -17. 45pp.
Australian National Audit Office (ANAO) (2013). Administration of the Domestic Fishing Compliance Program. 128pp.
Bax N. and Williams A. 2001. Seabed habitat on the south-eastern Australian continental shelf: context, risk and monitoring. Marine and Freshwater Research. 52: 491-512
Baelde (1995). Assessment of the blue-eye trevalla fishery and analysis of mid-water trawling. FRDC report 91/20.
Boag, S. (2016) Mitigation of Seabird Interactions in the trawl sectors of the Southern and Eastern Scalefish and Shark Fishery (SESSF). Programme Innovations Grants Project Report – INNOV-095. 39pp.
Branch, T. A. (2001). A review of orange roughy, Hoplostethus atlanticus, fisheries, estimation methods, biology and stock structure. South African Journal of Marine Science, vol 23, pp 181-203.
Chambers, M, Moore, A & Barnes, B (2014). Quantitative assessment of the western gemfish stock, ABARES research report, ABARES, Canberra.
Colgan, DJ & Paxton, JR (1997). ‘Biochemical genetics and recognition of a western stock of the common gemfish, Rexea solandri (Scombroidea: Gempylidae), in Australia’, Marine and Freshwater Research, vol. 48, no. 2, pp. 103–18.
Cordue, P (2013). Pink ling stock assessment: final ISL model results. Innovative Solutions Ltd. Client Report for the Australian Fisheries Management Authority, AFMA, Canberra.
Cordue, PL (2015). The 2015 stock assessment update for eastern and western Pink Ling, Innovative Solutions Ltd. Client Report for the Australian Fisheries Management Authority, AFMA, Canberra.
Day, J & Klaer, N (2014). Tiger flathead (Neoplatycephalus richardsoni) stock assessment based on data up to 2012, in GN Tuck (ed.), Stock assessment for the Southern and Eastern Scalefish and Shark Fishery 2013, part 1, Australian Fisheries Management Authority & CSIRO Marine Atmospheric Research, Hobart, 147–173.
DAFF (2007) Commonwealth Fisheries Harvest Strategy: Policy and Guidelines. Australian Government Department of Agriculture, Fisheries and Forestry, Canberra, Australia.
DSEWPC (2011), National recovery plan for threatened albatrosses and giant petrels 2011-2016, Commonwealth of Australia, Hobart.
DSEWPC (2013) Recovery Plan for the Australian Sea Lion (Neophoca cinerea).
Favero M, Blanco G, García G, Copello S, Seco Pon JP, Frere E, Quintana F, Yorio P, Rabuffetti F, Cañete G & Gandini, P (2011) Seabird mortality associated with ice trawlers in the Patagonian shelf: effect of discards on the occurrence of interactions with fishing gear. Animal Conservation, 14: 131–139.
Fulton, EA, Anthony D.M. Smith, David C. Smith (2007). Alternative Management Strategies for Southeast Australian Commonwealth Fisheries: Stage 2: Quantitative Management Strategy Evaluation. FRDC, AFMA.
Fulton EA, Smith ADM, Smith DC, Johnson P (2014) An Integrated Approach Is Needed for Ecosystem Based Fisheries Management: Insights from Ecosystem-Level Management Strategy Evaluation. PLoS ONE 9(1): e84242. doi:10.1371/journal.pone.0084242.
Georgeson, L., Nicol, S., Moore, A. and Green, R. (2016) Commonwealth Trawl and Scalefish Hook sectors. In ABARES 2016, Fishery status reports 2016, Australian Bureau of Agricultural and Resource Economics and Sciences, Canberra. CC BY 3.0.
Georgeson, L., Roelofs, A, Wakefield, C, Lyle, J and Chick, R. (2016b) Blue-eye trevalla (Hyperoglyphe antarctica). In Carolyn Stewardson, James Andrews, Crispian Ashby, Malcolm Haddon, Klaas Hartmann, Patrick Hone, Peter Horvat, Stephen Mayfield, Anthony Roelofs, Keith Sainsbury, Thor Saunders, John Stewart, Ilona Stobutzki and Brent Wise (eds) 2016, Status of Australian fish stocks reports 2016, Fisheries Research and Development Corporation, Canberra.
Gomon, M., Bray, D. and Kuiter, R. (2008). Fishes of Australia’s Southern Coast. Reed New Holland Publishers, Chatswood, NSW, Australia.
Haddon, M (2013a). Blue eye fishery characterization, CSIRO Marine and Atmospheric Research, Hobart.
Haddon, M (2013b). Tier 4 analyses in the SESSF, including deep water species: data from 1986–2012, CSIRO Marine and Atmospheric Research, Hobart.
Haddon, M (2015). Tier 4 analyses for selected species in the SESSF (data from 1986– 2014), draft version, CSIRO Oceans and Atmosphere, Hobart.
Hamer, P, Kemp, J, Robertson, S & Hindell J (2009). Use of otolith chemistry and shape to assess the stock structure of blue grenadier (Macruronus novaezelandiae) in the Commonwealth Trawl and Great Australian Bight fisheries, final report to FRDC, project 2007/020, Fisheries Research Branch, Queenscliff.
Hobday, A. J., Bulman, C., Williams, A., Fuller, M. (2011). Ecological risk assessment for effects of fishing on habitats and communities FRDC report 2009/029.
Kailiola, PJ., M.J. Williams, P.C. Stewart, R.E. Reichelt, A. McNee and C. Grieve (1993) Australian Fisheries Resources. Bureau of Resource Sciences and the Fisheries Research and Development Corporation, Canberra Australia.
Kirkwood, R., Pemberton, D., Gales, R., Hoskins, A., Mitchell, T., Shaughnessy, P. D., and Arnould, J. P. Y. (2010). Continued population recovery by Australian fur seals. Marine and Freshwater Research 61, 695–701.
Knuckey, IA (2009) Trials of seal excluder devices (SEDs) on a South East Trawl Fishery wet boat, final report to the Natural Heritage Trust.
Koopman, M., Boag, S. and Knuckey, I. (2014). Assessment of potential mitigation of seal interactions in the SESSF using shortened cod ends. AFMA Project 2012/0828. Fishwell Consulting 24 pp.
Mackay, A., Goldsworthy, S. and Harrison, P. (2016). Critical knowledge gaps: estimating potential maximum cumulative anthropogenic mortality limits of key marine mammal species to inform management. FRDC Final Report – 2015-035.
Moore, A, Ovenden, J & Bustamante, C (2016). Research to underpin better understanding and management of western gemfish stocks in the Great Australian Bight, FRDC project 2013/014, FRDC, Canberra.
Morison, AK, Knuckey, IA, Simpfendorfer, CA & Buckworth, RC 2013, South East Scalefish and Shark Fishery: draft 2012 stock assessment summaries for species assessed by GABRAG, ShelfRAG & Slope/DeepRAG, report for AFMA, Canberra.
MRAG Asia Pacific (2015). Coles Future Friendly Sourcing Assessment Framework. 12pp.
Paulovics, K, and Williams, H. (1995) The Australian blue-eye fishery. FRDC report 90/12.
Pitman, LR, Haddy, JA & Kloser, RJ 2013, ‘Fishing and fecundity: the impact of exploitation on the reproductive potential of a deep-water fish, orange roughy (Hoplostethus atlanticus)’, Fisheries Research, vol. 147, pp. 312–19.
Pogonoski, J.J. Pollard, D.A. and Paxton J.R. (2002). Conservation Overview and Action Plan for Australian Threatened and Potentially Threatened Marine and Estuarine Fishes. [Online]. Canberra, ACT: Environment Australia.
Punt. A.E. and B.L. Taylor. 2012. Stock Assessment of pink ling (Genypterus blacodes) using data up to 2010. In: G.N. Tuck [Ed.] Stock Assessment for the Southern and Eastern Scalefish and Sharkfish 2011, Part 1. Australian Fisheries Management Authority and CSIRO Marine and Atmospheric Research. Chapter 7, pp 103-160.
Phillips, K., Giannini, F., Lawrence, E., and Bensley, N. (2010). Cumulative assessment of the catch of non-target species in Commonwealth fisheries: a scoping study. Bureau of Rural Sciences, Canberra.
Pitcher, C.R., Ellis, N., Althaus, F., Williams, A., McLeod, I. (2015) Predicting benthic impacts & recovery to support biodiversity management in the South‐east Marine Region. Pages 24–25 in Bax, N.J. & Hedge, P. [Eds.]. 2015. Marine Biodiversity Hub, National Environmental Research Program, Final report 2011–2015. Report to Department of the Environment. Canberra, Australia.
SCS (2013). Blue Grenadier Fishery MSC Full Assessment Final Report.
SEMAC (2016). South East Management Advisory Committee SEMAC 24 16 & 17 February 2016 Minutes.
SlopeRAG (2015). SESS Fishery Slope Resource Assessment Group (SlopeRAG) Meeting #1 September 2015 Meeting Minutes.
Stewardson, C & Australia (2007). Dept of Agriculture, Fisheries and Forestry. National Seal Strategy Group 2007, National assessment of interactions between humans and seals : fisheries, aquaculture and tourism, DAFF, Canberra, A.C.T.
Thomson RB, Alderman RL, Tuck GN, Hobday AJ (2015) Effects of Climate Change and Fisheries Bycatch on Shy Albatross (Thalassarche cauta) in Southern Australia. PLoS ONE 10(6): e0127006. https://doi.org/10.1371/journal.pone.0127006
Tilzey, R. D. J. (2000). Report on the ling workshop held at Australian Fisheries Management Authority on 8 – 9 December 1998.
Tuck, G. (2008). Updated stock assessment of blue grenadier Macruronus novaezelandiae based on data up to 2007. 47pp.
Tuck, G (2013), Stock assessment of blue grenadier Macruronus novaezelandiae based on data up to 2012, CSIRO Marine and Atmospheric Research, Hobart.
Walker, T. I., Gason, A. S., and Koopman, M. (2006). SESSF scalefish abundance and spatial distributional trends from available ISMP data. Final report to Australian Fisheries Management Authority Project No. R05/1096.
Ward, RD, Appleyard, SA, Daley, RK & Reilly, A 2001, ‘Population structure of pink ling (Genypterus blacodes) from south-eastern Australian waters, inferred from allozyme and microsatellite analyses’, Marine and Freshwater Research, vol. 52, pp. 965–73.
Wayte, S., Dowdney, J., Williams, A., Bulman, C., Sporcic, M., Fuller, M., Smith, A. (2007) Ecological Risk Assessment for the Effects of Fishing: Report for the otter trawl sub-fishery of the Commonwealth trawl sector of the Southern and Eastern Scalefish and Shark Fishery. Report for the Australian Fisheries Management Authority, Canberra.
Weire A and Lok P (2007), Precaution and the Precautionary Principle: two Australian case studies, Productivity Commission, Commonwealth of Australia, 2007)
Williams, A., Bax, N. and Barker, B. (2006). Integrating fishing industry knowledge of fishing grounds with scientific data on seabed habitats for informed spatial management and ESD evaluation in the South East Fishery. Final report to the FRDC, project no. 2000/153. (CSIRO Marine and Atmospheric Research: Hobart, Australia).
Zhou, S., Smith, T., Fuller, M. (2007) Rapid Quantitative Risk Assessment for Fish Species in Selected Commonwealth Fisheries. Report for the Australian Fisheries Management Authority, Canberra, Australia.
Zhou, S., Fuller, M., and Daley, R. (2012). Sustainability assessment of fish species potentially impacted in the Southern and Eastern Scalefish and Shark Fishery: 2007-2010. Report to the Australia Fisheries Management Authority, Canberra, Australia. June 2012.
Zhou, S. Ross Daley, Mike Fuller, Cathy Bulman, Alistair Hobday, Tony Courtney, Paul Ryan, and Doug Ferrel. (2013). ERA extension to assess cumulative effects of fishing on species. Final Report on FRDC Project 2011/029. Canberra, Australia.