
Gemfish (Eastern and Western) – SESSF: Scalefish Hook Sector
Assessment Summary
Fishery Overview
Unless referenced, the following is adapted from Helidoniotis et al. (2017a).
The Scalefish Hook Sector (SHS) forms part of the Southern and Eastern Scalefish and Shark Fishery (SESSF) managed by the Australian Fisheries Management Authority (AFMA) on behalf of the Australian Government. The Scalefish Hook Sector targets Blue-eye Trevalla and pink ling using demersal longline, automatic longline, dropline and power handine gear. Gemfish (eastern and western stocks) are a retained, non-target species. The fishery is managed under the Southern and Eastern Scalefish and Shark Fishery Management Plan 2003 (Amendment 2016) and the Southern and Eastern Scalefish and Shark Fishery (SESSF) Harvest Strategy Framework (AFMA, 2017). Additionally, Eastern Gemfish are managed under the Eastern Gemfish Stock Rebuilding Strategy (AFMA 2015a).
Key species from the SHS are managed under total allowable catches (TACs) and individual transferable quotas (ITQs). TACs are determined by the AFMA Commission each year. Fishing effort in the SHS remained relatively constant, at 3.168 million hooks in 2015–16 and 3.192 million in 2016–17 (Figure 1). Total catch in 2016 was around 600 t. Fishing effort is broadly distributed from waters off Queensland to South Australia, while highest levels of effort in 2016-17 were seen off eastern Tasmania (Figure 2).
Figure 1: Catch and effort in the SESSF Scalefish Hook Sector, 2000 to 2016 (Source: Helidoniotis et al, 2017a).
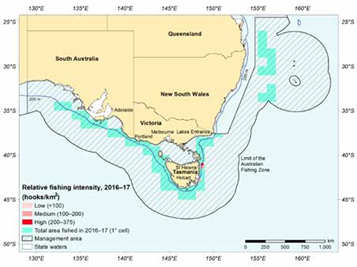
Figure 2: Relative fishing intensity in the SHS, 2016-17 fishing season (Source: Helidoniotis et al, 2017a).
Four separate units of assessment are examined here:
Risk Scores
|
Performance Indicator |
Blue-eye Trevalla – Longline |
Blue-eye Trevalla – Dropline |
Gemfish Eastern – Longline |
Gemfish Western – Longline |
|
LOW |
LOW |
HIGH |
MEDIUM |
|
|
1A: Stock Status |
MEDIUM |
MEDIUM |
HIGH |
MEDIUM |
|
1B: Harvest Strategy |
LOW |
LOW |
HIGH |
MEDIUM |
|
1C: Information and Assessment |
LOW |
LOW |
MEDIUM |
MEDIUM |
|
C2 ENVIRONMENTAL IMPACT OF FISHING |
LOW |
LOW |
LOW |
LOW |
|
LOW |
LOW |
LOW |
LOW |
|
|
2B: ETP Species |
LOW |
LOW |
LOW |
LOW |
|
2C: Habitats |
MEDIUM |
LOW |
MEDIUM |
MEDIUM |
|
2D: Ecosystems |
LOW |
LOW |
LOW |
LOW |
|
C3 MANAGEMENT |
LOW |
LOW |
LOW |
LOW |
|
3A: Governance and Policy |
LOW |
LOW |
LOW |
LOW |
|
3B: Fishery-specific Management System |
LOW |
LOW |
LOW |
LOW |
Summary of main issues
- The Eastern Gemfish stock is currently overfished. The stock is managed according to a formal rebuilding strategy which aims to recover the stock to the limit reference point by 2027, however there is limited evidence of rebuilding at this stage.
- There is considerable uncertainty in the Tier 1 and Tier 4 assessments for the Western Gemfish stock.
- The fishery appears relatively well-placed against most of the Component 2 performance indicators, although there is uncertainty about the spatial overlap of auto-longlining on potentially sensitive habitats.
- The fishery is well-positioned against management system performance indicators.
Outlook
Gemfish (Eastern) – Longline
| Component | Outlook | Comments |
| Target species | Uncertain | Stock projections suggest the stock should rebuild to the limit reference point by 2027, although recruitment levels have been below average in recent years and there is limited evidence of recovery to date. |
| Environmental impact of fishing | Stable | Additional analysis of the extent of spatial overlap between autoline gear and high risk habitats may result in a lower risk score. |
| Management system | Stable | No major changes are expected to Component 3 PIs |
Gemfish (Western) – Longline
| Component | Outlook | Comments |
| Target species | Uncertain | There are uncertainties around the Tier 1 and Tier 4 assessments for this stock, although catches have been stable in recent years and are low as a proportion of the RBC and below the Great Australian Bight catch trigger. Alternative assessment approaches are currently being explored. |
| Environmental impact of fishing | Stable | Additional analysis of the extent of spatial overlap between autoline gear and high risk habitats may result in a lower risk score. |
| Management system | Improving | No major changes are expected to Component 3 PIs |
Complete Report
COMPONENT 1: Target fish stocks
1A: Stock Status
CRITERIA: (i)The stock is at a level which maintains high productivity and has a low probability of recruitment overfishing.
(a) Stock Status
| Gemfish – Eastern stock |
HIGH RISK |
|
There are two distinct stocks of Gemfish in Australia, an eastern and western stock, separated by a boundary at the western end of Bass Strait (Colgan & Paxton 1997; Moore et al. 2016).
Catch of Gemfish in the eastern zone peaked at more than 6,000 t in 1978, and declined rapidly after 1987 (Helidoniotis et al, 2017a). The landed eastern zone catch in 2016-17 was 30.4t. An integrated stock assessment model for Eastern Gemfish was first developed in 2008 and was last updated in 2010 with data on catch and length frequency up to 2009 (Helidoniotis et al, 2017a). The estimates of spawning stock biomass did not differ greatly among years, with the base-case model estimating that the spawning stock biomass in 2009 was 15.6 per cent of the 1968 level (Figure 4). Helidoniotis et al (2017a) report that a preliminary tier 1 update on the 2010 assessment indicated that the spawning stock biomass in 2015 had decreased to 8.3 per cent (0.083SB0), likely as a result of a lack of recruitment. Given the most recent assessment estimated the stock to be below the limit reference point, Helidoniotis et al (2017a) concluded the stock remains overfished.
On that basis, the stock does not meet the medium risk SG and we have scored this SI high risk.
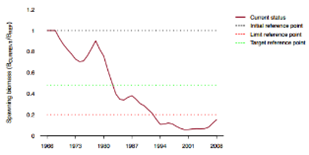
Figure 4: Estimated spawning stock biomass of Gemfish, eastern zone 1966 to 2008 (Source: Helidoniotis et al, 2017a)
| Gemfish – Western stock |
MEDIUM RISK |
A total of 73.3 t of western Gemfish was landed in 2016–17 (Helidoniotis et al 2017a). Historically, a substantial catch of western Gemfish was taken within the SESSF Great Australian Bight Trawl Sector (GABTS), however in recent years catch has been very limited due to a cessation of targeting rather than declines in abundance (Helidoniotis et al 2017a).
Helidoniotis et al (2017a) report that the western Gemfish stock was assessed using both Tier 1 and Tier 4 assessments in 2016, using data from 1986 to 2015. The tier 1 assessment updated the 2014 assessment and included updated data from both the CTS and the GABTS. Data included catch-and-effort data, and age error data. The estimated spawning biomass depletion for the CTS and the GABTS combined from the tier 1 assessment was 43 per cent (Figure 5). Helidoniotis et al (2017a) noted that varying discard rate changes in fishing grounds and the potential for hyperstability are not explicitly accounted for in the standardisation and may bias results if not accurately indexing abundance. Nevertheless, they concluded that the stock was neither overfished, nor subject to overfishing.

Figure 5: Estimated spawning stock biomass of gemfish, western zone, 1985 to 2015, for the CTS and the GABTS (Helidoniotis et al, 2017a)
GABRAG (2017) noted that the Tier 1 assessment outcomes were highly uncertain and recommended exploration of alternate assessment approaches. A Tier 5 (catch-MSY) assessment has recently been undertaken though outputs were not available.
In the absence of a robust Tier 1 assessment, GABRAG (2016) agreed to take a weight of evidence based approach to its recommendations on RBCs/TACs. They noted that although there was insufficient data to assess the likelihood of the stock declining below the limit reference point, considering the CTS (and SHS) RBC was between the upper and lower estimates from the Tier 4 assessment, there was little risk of the stock declining below the limit reference point.
Accordingly, given the very limited harvest of the stock and the weight of evidence suggesting the stock is unlikely to decline below the limit reference point, is appears at least likely that the stock is above the PRI. Nevertheless, there is insufficient certainty in the information to indicate the stock is fluctuating at or around levels consistent with MSY. On this basis, we have scored this SI medium risk
PI SCORE – MEDIUM RISK – Gemfish – Western
PI SCORE – HIGH RISK- Gemfish – Eastern
1B: Harvest Strategy
CRITERIA: (i) There is a robust and precautionary harvest strategy in place.
| (a) Harvest Strategy |
The SESSF harvest strategy consists of:
- Limited entry;
- Catch controls through TACs and ITQs, set according to well-defined harvest control rules under the SESSF Harvest Strategy Framework (HSF; AFMA, 2017);
- Gear restrictions;
- Monitoring through logbooks and catch disposal records (CDRs);
- Monitoring through VMS;
- Monitoring through independent observers who provide estimates of discards; and
- Periodic assessments of stock status.
A HSF has been in place in the SESSF since 2005. The most recent version of SESSF HSF was agreed in 2017 (AFMA, 2017). The SESSF HSF is designed to meet the objectives of the Commonwealth Fisheries Harvest Strategy Policy 2007 (HSP), namely “the sustainable and profitable use of Australia’s Commonwealth fisheries in perpetuity through the implementation of harvest strategies that maintain key commercial stocks at ecologically sustainable levels, and within this context, maximise the economic returns to the Australian community” (DAFF, 2007). To meet this objective, harvest strategies are designed to pursue an exploitation rate that keeps fish stocks at a level required to produce maximum economic yield (MEY) and ensure stocks remain above a limit biomass level (BLIM) at least 90% of the time. Alternative reference points may be adopted for some stocks to better pursue the objective of maximising economic returns across the fishery as a whole (AFMA, 2017).
The following summary of the HSF structure and processes is adapted from AFMA (2017):
The HSF uses a three tier approach designed to apply different types of assessments and cater for different amounts of data available for different stocks. The HS adopts increased levels of precaution that correspond to increasing levels of uncertainty about stock status, in order to reduce the level of risk associated with uncertainty. Tier 1 represents the highest quality of information available (i.e. a robust integrated quantitative stock assessment).
Each Tier has its own harvest control rule (HCR) that is used to determine a recommended biological catch (RBC). The RBCs provide the best scientific advice on what the total fishing mortality (landings from all sectors plus discards) should be for each species/stock. For all Tier levels, once the RBC is determined from the results of the assessment and the application of the relevant HCR, a recommended total allowable catch (TAC) is calculated based on the TAC setting rules.
For Tier 1, the HCR is based on the following reference points:
- The limit biomass BLIM –The default BLIM proxy is B20 = 20% of the unfished spawning biomass;
- The BMSY – the default BMSY proxy is B40 = 40% of the unfished spawning biomass;
- The target biomass BTARG (MEY) – BTARG is generally equal to BMEY, for which the default proxy is approximated by 1.2*BMSY. If the default BMSY proxy is used, this results in B48 = 48% of the unfished spawning biomass.
The Tier 1 harvest control rule applies to species and/or stocks where there is a robust quantitative assessment that provides estimates of current biomass levels, and where estimates or appropriate proxies are available for BLIM, BTARG and FTARG.
Tier 3 and Tier 4 assessments use other indicators (relating to fishing mortality and catch rates respectively) and reference points which are taken as proxies for the biomass reference points for Tier 1.
A Tier 3 stock assessment uses information available on the age structure of annual catches and annual total catch weight, as well as knowledge of basic biological parameters, e.g. natural mortality, length at age, weight at length, the stock recruitment relationship steepness, fecundity at age and selectivity at age. The catch control rule uses the ratio of the target exploitation rate to the actual exploitation rate as a multiplier on the current average catch to determine the RBC.
The Tier 4 assessment is based entirely on catch and CPUE. The Tier 4 analysis determines an RBC by selecting CPUE reference points that are taken as proxies for the estimated BLIM and BTARG. This is done by assuming that the CPUE is proportional to stock abundance, an assumption that is made in most SESSF assessments.
HCRs under each Tier of the HSF have been subject to robust simulation testing (e.g. Wayte, 2009) with results published in peer-reviewed journals (e.g. Little et al, 2011).
The status of fish stocks in the SESSF, and how they are tracking against the HSF, is reported to the relevant Resource Assessment Group (RAG), the relevant Management Advisory Committee (MAC) and AFMA Commission as part of the yearly TAC setting process. The data used for input into the stock assessment process are collected by the observer-based Integrated Scientific Monitoring Program (ISMP), AFMA logbooks and Catch Disposal Records (CDRs) and periodic trawl-based Fishery Independent Surveys (FIS). Otoliths from the biological sampling are provided to a private contractor for ageing. All sampling and age data are provided to stock assessment scientists for analysis or reporting. Stock assessment reports are produced by CSIRO or other contracted assessment specialists and discussed by the RAG. The outcomes of assessments are run against the HCRs in the HSF to produce recommended biological catch (RBC) amounts for each quota species. Other sources of mortality, including an estimate of future discards, catch taken by other jurisdictions (e.g. State and recreational sectors) and a research catch allowance, are subtracted from the RBC to produce a Commonwealth TAC.
Each stock is assessed under the appropriate Tier level as advised by the relevant RAG. In mid-December, AFMA produces a position paper with recommended TACs for quota species for the upcoming fishing season, based on the stock assessments and RAG advice. The paper is distributed to interested parties and undergoes a public comment period.
In early February, a MAC TAC Setting meeting is held where TAC recommendations are made. The outcomes of the RAG and MAC together with the AFMA position paper and any public comments received, are then sent to the AFMA Commission to determine TACs for the upcoming fishing season in mid-February.
| Gemfish – Eastern |
HIGH RISK |
The integrated stock assessment model (tier 1) for Eastern Gemfish was last updated in 2010 (Little and Rowling, 2010), with spawning stock biomass estimates of 15.6% of the 1968 level (0.156 SB0). The 2010 assessment provided biomass projections based on two scenarios: total catches of 0 and 100 t each year. The projection for zero catch suggested that the biomass might reach 0.20 SB0 (the limit reference point, LRP) before 2020, while projections for annual catches of 100 t reached the LRP in 2025 (Little and Rowling, 2010).
The 2008 Eastern Gemfish rebuilding strategy adopted a time frame of nine years to reach the LRP, however given poor recent recruitment AFMA believed that this timeframe was unlikely to be met (AFMA 2015a). The updated 2015 rebuilding strategy has adopted the rebuilding timeframe of one mean generation time plus 10 years (approximately 19 years from 2008), which is in line with the HSP. The rebuilding strategy aims to rebuild Eastern Gemfish to, or above, the limit reference point by 2027.
Once rebuilt to the limit reference point, the rebuilding strategy aims to rebuild the stock to the default BMSY reference point of B40, and then to the BMEY reference point of B48 (AFMA, 2015a). No target timeline is provided for rebuilding to the BMSY level.
The rebuilding strategy provides for zero targeted catch, but allows for an incidental take of 100t. The incidental take limit of 100t has been in place since 2002 (AFMA, 2015a). Additional fishing mortality may arise from discarding, which is estimated through observer coverage. The incidental catch TAC level is reviewed by SERAG annually and may be increased or decreased depending on information about targeting behaviour or changes to fishing mortality and biomass.
Additional measures in the rebuilding plan which serve to limit exploitation include increasing codend mesh size (minimum of 90 mm mesh size), deepwater spatial closures (introduced to limit exploitation of upper slope dogfish species, but will also offer some protection to eastern Gemfish) and compulsory pre-reporting for fishers landing eastern gemfish during the species annual spawning migration (to allow for data collection) (AFMA, 2015a).
In addition to the rebuilding strategy, an industry Code of Practice is in place through the South East Trawl Fishing Industry Association (SETFIA), which encourages fishers to actively avoid catching eastern gemfish and highlights the importance of accurately recording data. The Code also includes a measure asking fishers to communicate the location of large shots of eastern Gemfish to others in an effort to increase avoidance and reduce incidental catches. The development of the Code saw a reduction in the total fishing mortality (catch and discards) by approximately a third between 2010 to 2011 (AFMA, 2015a).
SERAG (2016) notes that total fishing mortality (retained catch plus discards) in Commonwealth fisheries was below the incidental TAC in 2012, 2014 and 2015. Helidoniotis et al (2017a) also report that the total fishing mortality was 77.4t in the 2016-17 fishing year, which is below the incidental TAC. However, discards in 2013 were around 131t and, together with retained catches, meant the total fishing mortality was around double the incidental TAC. On the basis that recent catch history includes years when the incidental catch allowance was exceeded, indicating that management arrangements may not be sufficient to limit fishing mortality, Helidoniotis et al (2017a) classified the stock as ‘uncertain if subject to overfishing’.
Eastern Gemfish are also taken by dropline fishers in the NSW Ocean Trap and Line Fishery (OTLF) (Chick, 2015). Fishers are subject to a 50kg/trip limit, with reported catches between 2009-10 and 2013-14 ranging from 10-20t. More recent commercial catch information was not found. Landings by recreational fishers have previously been estimated at 10t (Henry and Lyle, 2003), although no more recent estimate is available. Chick (2015) notes that the catch in the NSW charter boat sector is likely to be ‘significant’ although total catches are not provided. The charter sector is subject to a 10 fish per boat limit. AFMA (2015a) notes that recreational and NSW commercial catch have the potential to impact on recovery times, however estimates of catch from both of these sectors are unreliable and need improvement (AFMA, 2015a).
SERAG (2016) noted that despite a long period of management under the rebuilding strategy there is no evidence of any stock rebuilding. In practice, rebuilding appears to be constrained by poor recruitment. While a relatively strong recruitment event occurred in 2002, recruitments during the last 25 years have been relatively weak which contrasts with the 1970s when recruitment was variable, but generally higher (Little and Rowling, 2010).
In essence then, a harvest strategy is in place to recover the stock to the limit reference level (and then ultimately to the BMEY target level). Assessment modelling indicates that, under average recruitment conditions and at a 100t catch, the stock should recover to the limit reference level by 2025. Catches within Commonwealth fisheries have been largely compliant with incidental catch limits, although there was a considerable overrun in one recent year. Catches in NSW fisheries are likely to be smaller but data are uncertain. Collectively, there is some probability that Commonwealth and State catches exceed the 100t allowance modelled in the most recent stock assessment. Little and Rowling (2010) cautioned that the projection of the stock recovering to the limit reference point by 2025 under the 100t catch limit noted that the “depends strongly on the average recruitment operating for the stock in the future (which has not occurred in recent years) and whether catches exceed the bycatch limit”.
While there is some argument that the harvest strategy will achieve the stock management objectives reflected in criteria 1A(i) over time, there is uncertainty around whether the objectives will be achieved primarily as a result of poor recruitment, but also as a result of uncertainty in some catch data. Given the overfished state of the stock, we have scored this SI high risk. The UoA would be better placed with stronger information on total catches across the stock and some evidence of recovery.
| Gemfish – Western |
MEDIUM RISK |
Management of the western Gemfish stock is complex with catches taken across multiple sectors. The SHS harvest is managed under the SESSF TAC, but may be taken in the Western Bass Strait (WBS) or the Great Australian Bight (GAB). The stock is also accessed by the Commonwealth Trawl Sector, whose catches are also managed within the SESSF TAC, but may only be taken within the WBS. The SESSF TAC for the 2016-17 fishing season was 247t. Catches are also taken in the GAB Trawl Sector (GABTS) for which there is no TAC. Whereas western Gemfish are targeted in the CTS, incidental catches in the GABTS are more common. Catches in GABTS are in addition to the SESSF TAC and are subject to a trigger point in the SESSF HSF which requires a full assessment to be undertaken if catch exceeds 1000 t over three years (AFMA 2017a).
Combined catches in Commonwealth fisheries in 2016-17 were 73.3t, with discards estimated at around 63t. This was well below the RBC of 247t.
The main uncertainties in the harvest strategy are the state of the stock itself given the uncertainty in assessments (GABRAG, 2017), and the potential for unconstrained catches in the GABTS to undermine the effectiveness of catch constraints in the CTS and SHS. Given the uncertainties over stock status, it is not clear that the harvest strategy is directly responsive to the state of the stock. Nevertheless, given catches across all sectors are closely monitored, catches in the GABTS are subject to a formal review if they exceed a predefined level and averaged only 29t between 2011 and 2015, and uncertainty is taken into account in recommending RBCs and TACs in the non-GABTS sectors, there is a plausible argument that the harvest strategy is expected to achieve the stock management objectives reflected in criterion 1A(i). Accordingly, we have scored this SI medium risk.
(b) Shark-finning
NA
CRITERIA: (ii) There are well defined and effective harvest control rules (HCRs) and tools in place.
| (a) HCR Design and application | ||
Well-defined HCRs are set out for each Tier 1-4 species covered by the SESSF HSF (AFMA, 2017). HCRs are designed to achieve the objectives set out in the HSF which in turn has been designed to meet the Commonwealth HSP (DAFF, 2007).
Under the HSF, for Tier 1 stocks the target fishing mortality rate FTARG represents the fishing mortality rate that would result in a spawning biomass of BTARG (equal to BMEY). The default value for FTARG is F48, the value of F corresponding to a BTARG of B48. Alternative reference points may be adopted for some stocks to better pursue the objective of maximising economic returns across the fishery as a whole. The recommended maximum fishing mortality rate for Tiers 3 and 4 is FMSY (the default proxy for which is F40). This represents the fishing mortality rate that would cause the spawning biomass to decline to its maximum sustainable biomass BMSY (the default proxy for which is B40). The breakpoint, or HCR inflection point, in the overfishing line in Figure 11 occurs at a biomass corresponding to BMSY. If B<BMSY or F>FMSY, the TACs should be reduced to limit fishing effort and the fishing mortality rate. For Tier 1, the recommended maximum fishing mortality rate and HCR inflection point occurs at a proxy of F35.
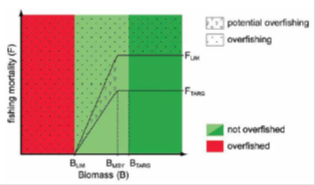
Figure 6: Schematic representation of a harvest control rule, showing key reference points (Source: AFMA, 2017)
Recommended Biological Catch (RBC) is calculated according to the following (AFMA, 2017):
Tier 1
The formula for calculating FTARG is as follows:
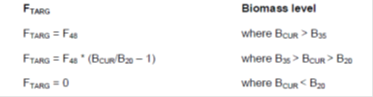
The RBC is calculated by applying FTARG to the current biomass BCUR to calculate the total catch (including discards) in the next year, using the agreed base case assessment model:
At Tier 1, BLIM = B20, the maximum value for FTARG = F48 and the breakpoint in the HCR occurs at B35. Alternative reference points may be adopted for some stocks to better pursue the objective of maximising economic returns across the fishery as a whole.
The HCRs are robust to the main uncertainties and there is substantial evidence that the HCRs have been successfully implemented across a diverse range of gear types and species of Commonwealth fisheries. Additional HCRs are also applied for specific fisheries or species where necessary, developed through the RAGs, and applied and monitored by AFMA.
Tier 3
The Tier 3 HCR applies to species and/or stocks that do not have a quantitative stock assessment, but where estimates of fishing mortality and other biological information are available (AFMA, 2017). Yield per recruit calculations are used to calculate F values that will reduce the spawning biomass to 20% (F20), 40% (F40) and 48% (F48) of the unexploited level.
Recommended biological catch CRBC is calculated according to the following formula:

where FCUR is the estimated current fishing mortality, and FRBC is the selected F for the recommended biological catch from the control rule. The estimate of fishing mortality is limited to be no less than 0.1 of natural mortality.
Tier 4
The Tier 4 control rule is of the form:
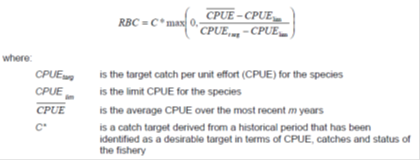
A range of considerations are then taken into account in translating the RBC into a TAC. For Tier 4 species a ‘discount factor’ of 15% is applied to account for greater levels of uncertainty in these stocks. Other sources of mortality including state catches, discards and any research catch allowance are then subtracted from the RBC to produce a Commonwealth TAC.
Multi-year TACs are to be applied for all Tier 1 and Tier 4 species where suitable. Where the RBC is zero, an incidental bycatch TAC may be set after considering a range of circumstances including the impact of incidental catches on rebuilding of the stock.
| Gemfish – Eastern |
MEDIUM RISK |
The eastern stock of Gemfish is currently below the limit reference point and subject to a formal rebuilding strategy. The strategy aims to recover the stock to the limit reference point of B20 by 2027 (one mean generation time plus 10 years), and from there ultimately to the target reference point of B48 (AFMA, 2015a). The stock is formally listed as a Tier 1 stock under the HSF. The most recent stock assessment was completed in 2010, with targeted catch set at zero consistent with the Tier 1 HCR. Key uncertainties in the operation of the HCRs are the capacity to undertake robust Tier 1 assessments given recent catch rates cannot be used as a reliable index of abundance due to avoidance behaviour of operators (SERAG, 2016), and the appropriateness of current limits under lower than average recruitment conditions which have been persistent in recent years. The HCR also does not include State catches which are uncertain. While a well-defined HCR exists and serves to control exploitation, it is not clear that it is robust to these main uncertainties. Accordingly, we have scored this SI medium risk.
| Gemfish – Western |
MEDIUM RISK |
There are effectively two types of HCR which apply to Commonwealth fisheries accessing the western Gemfish stock: the Tier 1 HCR applying to TACs for the CTS and SHS and the catch trigger applying to the GABTS. While the Tier 1 HCR is a well-defined HCR which ensures that exploitation is reduced as PRI is approached and could be expected to keep the stock fluctuating around levels consistent with MSY, Tier 1 assessments of the western Gemfish stock are currently highly uncertain (GABRAG, 2017). In practice, a weight of evidence based approach taking into account the outcomes of Tier 1 and Tier 4 assessments and recent catch history has been used to recommend RBCs and TACs (GABRAG, 2016). In the GABTS, the current trigger point in HSF is more consistent with a generally understood HCR which is available to the management agency. While tools are available to the management agency to reduce exploitation in the GABTS (e.g. quota), these are not yet in place. Accordingly, we have scored this SI medium risk.
PI SCORE – MEDIUM RISK – Gemfish – Western
PI SCORE – HIGH RISK – Gemfish – Eastern
1C: Information and Assessment
CRITERIA: (i) Relevant information is collected to support the harvest strategy.
(a) Range of information
| Blue-eye Trevalla | LOW RISK | |
Comprehensive information on fleet composition, catch and other fishery-wide indicators is collected through the monitoring programs described in AFMA (2017). Catch data are collected through compulsory logsheets and catch document records.
For assessment purposes, it is assumed that there is one Australian Blue-eye Trevalla stock separate from the New Zealand stock(s). Genetic studies found no evidence of regional population structuring however, otolith microchemistry suggest that areas off New South Wales could be important for mixing (Georgeson et al. 2016b). A new report on stock structure was finalized in January 2017 and will inform a stock structure workshop scheduled for March 2018 (SERAG, 2017).
The biology of Blue-eye Trevalla is well understood, and is summarised in two FRDC reports (Baelde 1995; Paulovics and Williams 1995). As with all other Commonwealth fisheries, the composition of the fleet and the distribution of the catch are also well understood.
Notwithstanding the historical difficulties associated with understanding the impact of orca depredation and spatial closures on commercial CPUE, there is sufficient relevant information available for Blue-eye Trevalla to support the harvest strategy.
|
Gemfish – Eastern |
MEDIUM RISK |
There is sufficient information to suggest there are two biologically distinct stocks of Gemfish in Australia: an eastern stock and a western stock, separated by a boundary at the western end of Bass Strait (Colgan & Paxton 1997; Moore et al. 2016). Eastern Gemfish are distributed from Cape Moreton, southern Queensland, along the east coast to Bass Strait and the waters off Tasmania. Western Gemfish are distributed from Ningaloo Reef and Geraldton through the Great Australian Bight (AFMA 2015a). Eastern Gemfish are mesopelagic and inhabit waters from 100 m to 700 m but are generally found at 250 m – 500 m deep. They are generally caught close to the sea floor but the fish are likely to move into mid-water at times (Kailola et al. 1993; Pogonoski et al. 2002). Their life history characteristics are well understood and are summarised in the 2015 Eastern Gemfish Rebuilding Strategy (AFMA 2015a).
The composition of the fleet and the distribution of the catch are very well understood, particularly for Eastern Gemfish in recent years when efforts to reduce potential targeting have required scrutiny of catch and effort data to the vessel level.
The current harvest strategy is based around limiting fishing mortality to a 100t incidental mortality limit to allow the stock to rebuild to the limit reference point by 2027 (AFMA, 2015a). While catches and discards in Commonwealth fisheries are relatively well understood, AFMA (2015a) notes that information on catches from NSW commercial and recreational fisheries are unreliable and require improvement. Given the sensitivity of rebuilding targets to constraining catches with the bycatch limit, we have scored this SI medium risk on the basis that current information may not be sufficient.
|
Gemfish – Western |
MEDIUM RISK |
Good information exists on stock structure and fleet composition for the western Gemfish stock. Catches and effort are estimated across the main fleets and some information on discarding is available through the ISMP. However, GABRAG (2016) noted considerable uncertainty exists in the CPUE data and discarding and there have been challenges in collecting representative data in the GABTS to support stock assessments given the very low levels of effort. These have meant that Tier 1 assessments are unreliable. Moreover, Tier 4 assessments are highly senstive to the inclusion of discards. Accordingly, while some information is available to support the harvest stratgey, consistent with medium risk, at this stage information is insufficient to support the Tier 1 HCR.
| (b) Monitoring and comprehensiveness |
Generic monitoring arrangements in place for the SESSF are described in the HSF (AFMA, 2017). These include:
Logbooks and catch records
AFMA requires fishers to record catch and effort information in logbooks at sea, and in catch disposal records (CDRs) which record the actual landed catch at port. CDRs are considered more accurate than logbook records. Data recorded for each fishing operation includes: the port and date of departure and return; gear type and fishing method; number of fish kept and discarded; and resultant catch and product form (e.g. trunked, gutted, filleted, whole).
The Integrated Scientific Monitoring Program (ISMP)
A key component of the ISMP is the sampling and recording of catches at ports and on board fishing vessels using fishery-independent observers. The purpose of the ISMP is to provide reliable, verified and accurate information on the fishing catch, effort and practice of a wide range of vessels operating inside and, periodically, outside the Australian Fishing Zone. Biological and environmental data are collected on: catch composition including size and weight; amount and type of incidental catch; number of fish kept and discarded;fate of target and non-target species; interactions with TEP species; and fishing effort.
Fishery Independent Surveys (FIS)
The FIS is an industry-based fishery-independent resource survey which provides a timeseries of relative abundance indices for key target species (e.g. Knuckey et al, 2015). A FIS has been conducted for key target species in the SESSF since 2008. Biological and environmental data are collected such as: target species; catch rate (kg/shot); fishing method; and fishing depth. Information which provides a relative abundance index of other main byproduct and incidental catch species is also obtained.
Stock abundance is monitored through models of varying sophistication based on data availability for Tier 1, 3 and 4 species. All UoA removals, including state catches and discards, are estimated in TAC decision making.
| Gemfish – Eastern |
MEDIUM RISK |
The Tier 1 HCR in place for Eastern Gemfish under the HSF means the target catch levels have been set at zero, with a 100t incidental catch allowance. This is consistent with the rebuilding strategy. Stock abundance has not been monitored regularly because recent catch rates cannot be used as a reliable index of abundance due to avoidance behaviour of operators (SERAG, 2016). Nevertheless, one at least one indicator (catch) is monitored in the context of previous stock assessment results indicating the stock should rebuild to the limit level by 2025 at 100t catch. In Commonwealth fisheries, removals from the stock (retained and discards) are monitored against the incidental catch allowance. Nevertheless, information on commercial and recreational catches in NSW is less comprehensive (AFMA, 2015a). Accordingly, there is not good information on all other removals from the stock and we have scored this SI medium risk.
| Gemfish – Western |
MEDIUM RISK |
Stock abundance in the western Gemfish stock has been monitored through periodic Tier 1 and Tier 4 assessments, although there is considerable uncertainty in the outputs (GABRAG, 2016; 2017). Much of the available information support stock assessments comes from the CTS; catches are low in the GABTS so catch rate analysis is generally not informative. Existing assessment outputs have insufficient certainty to support either Tier 1 or Tier 4 HCRs, so a weight of evidence based approach has been used to set TACs, taking into account the outcomes of both Tier 1 and Tier 4 assessments and recent catch history (GABRAG, 2016). Removals from the main sectors (CTS, SHS, GABTS) are monitored, including estimates of total discards. Given some estimate of relative risk to the stock has been assessed in the context of the requirements of the SESSF HSF, and removals are monitored, we have scored this SI medium risk.
CRITERIA: (ii) There is an adequate assessment of the stock status.
(a) Stock assessment
| Gemfish – Eastern |
MEDIUM RISK |
|
Eastern Gemfish is managed as a Tier 1 species with an integrated stock assessment model last updated in 2010 (Little and Rowling, 2010). Spawning stock biomass was estimated at 0.156 SB0, with biomass projections based on a scenario of zero catch and 100 t catch per year. The assessment is appropriate for the stock and estimates status relative to reference points in the HSF. Nevertheless, the age of the assessment model (i.e. 2010) means there is some uncertainty around the extent to which the outcomes reflect current stock status. Moreover, given changes in the characteristics of the fishery (e.g. avoidance behaviour by fishers and low levels of catch) there is uncertainty around the usefulness of some previously used indices (e.g. CPUE). Nevertheless, the exitsing model together with other information (e.g. incidental catch levels) has been sufficient to assign a status relative to generic reference points (e.g. overfished/not overfished). Accordingly, this SI is scored as medium risk.
| Gemfish – Western |
MEDIUM RISK |
|
An integrated stock assessment model (tier 1) was developed for western Gemfish in the CTS and the GABTS in 2011, and was last updated in 2016 (GABRAG, 2016). The model was run using the most recent version of Stock Synthesis and incorporated new CPUE, age and length data. GABRAG noted the CPUE data used to inform the assessment was unreliable and there were a range of other uncertainties (e.g. length frequency sampling is unrepresentative, the small volume fish being caught in the GABTS is likely to be unrepresentative of the western Gemfish resource in the GAB) (GABRAG, 2016). Standardised CPUE-based Tier 4 assessments have also been completed for the stock although these are highly sensitive to the inclusion of discards. Given the uncertianties in current assessments, a Tier 5 assessment was explored in 2017 although outputs were not presented (GABRAG, 2017).
In light of the uncertainties in Tier 1 and Tier 4 assessments, GABRAG (2016) used a weight of evidence based approach to assess the generic risk of current levels of fishing mortality on the stock and concluded that there was little risk of the stock declining below the limit reference point. To that end, notwithstanding uncertainties in the available assessments, the existing information has been sufficient to estimate status against generic reference points which appropriate to the stock. Accordingly, we have scored the stock medium risk. Nevertheless, we note the UoA would be substantially better placed against this SI with a more reliable assessment.
(b) Uncertainty and Peer review
| Gemfish – Eastern |
MEDIUM RISK |
|
Eastern Gemfish are subject to a Rebuilding Strategy that requires annual assessment and review. The Eastern Gemfish stock assessment identifies and takes into account the main sources of uncertainty, albeit that the assessment is now eight years old. Key uncertainties in more recent data (e.g. avoidance behaviour by fishers is likely to mean catch rate data is unreliable) are identified in generic assessments of stock status (i.e. overfished/not overfished) but have not been taken into account in a more recent assessment.
| Gemfish – Western |
MEDIUM RISK |
|
Uncertainties in the existing Tier 1 and Tier 4 stock assessments have been identified, but not yet taken into account. A Tier 5 assessment was explored in 2017 (GABRAG, 2017).
PI SCORE – MEDIUM RISK – Gemfish – Eastern, Gemfish – Western
COMPONENT 2: Environmental impact of fishing
2A: Other Species
CRITERIA: (i) The UoA aims to maintain other species above the point where recruitment would be impaired (PRI) and does not hinder recovery of other species if they are below the PRI.
| (a) Main other species stock status | ||
The intent of this scoring issue is to examine the impact of the UoA on ‘main’ other species taken while harvesting the target species. ‘Main’ is defined as any species which comprises >5% of the total catch (retained species + discards) by weight in the UoA, or >2% if it is a ‘less resilient’ species. The aim is to maintain other species above the point where recruitment would be impaired and ensure that, for species below PRI, there are effective measures in place to ensure the UoA does not hinder recovery and rebuilding. Blue-eye trevalla is assessed under Component 1 in the full assessment report.
For this assessment, we have determined main other species from catch data for each gear type from 2010/11 to 2014/15 (AFMA, unpublished data). Where information on stock status for a species was not available, the relevant Ecological Risk Assessment (ERA) scores are used to estimate risk of overfishing to each species.
| Dropline/power handline |
LOW RISK |
To calculate catch composition we used reported retained and discarded catches for species taken using dropline and power handline gear. In the five-year period from 2010/11 to 2014/15, Blue-eye Trevalla accounted for 82% of the combined catch. No non-target species accounted for >5% of the catch, with the highest being hapuku at 4.5%. Two shark species comprised >2% of the catch and could be considered ‘less resilient’ – bronze whaler (2.4%) and shortfin mako (2.2%). Shortfin mako is assessed as an ETP species below.
Bronze whaler
Average catches of bronze whaler across the five year period were approximately 1.3t per year. No detailed stock assessment has been carried out for any of the populations of this species throughout its global distribution, because of insufficient biological and fishery data (e.g., catch at age etc.) (Jones 2008). Nevertheless, catches of bronze whaler in the SESSF are monitored against trigger limits designed to detect targeted fishing (in the case of the upper limit) and population declines (in the case of the lower limit). Catches for 2015-16 (5.8t) and 2016-17 (0.94t) were well below the lower trigger limit of 10t (SharkRAG, 2016). However, SharkRAG noted that the reference limits were largely superseded by the AFMA ERA reports and recommended discontinuing the triggers without further action. Catches in the dropline and power handline sectors are very small in comparison to other Australian fisheries (e.g. the South Australian Marine Scalefish Fishery – between 40-90t during 2010-11 to 2014-15). Although there is limited evidence of the population in relation to PRI, the SHS has measures in place (ERAs, catch monitoring, TACCs for target species which will indirectly serve to limit effort) that could be expected to ensure the fishery does not hinder recovery.
| Longline |
LOW RISK |
Auto longline has become the predominant gear type for the fishery, with 90% of the total Blue-eye Trevalla catch harvested by this gear type in 2014/15. Over the five-year period from 2010/11 to 2014/15, 30% of the total catch was Blue-eye Trevalla, 44% was pink ling and 8% was ribaldo.
Pink Ling
Although genetic variation between eastern and western pink ling has not been found (Ward et al. 2001), differences in catch-rate trends, and size and age (Morison et al. 2013), indicate that there are either two separate stocks, or that exchange between eastern and western components of the pink ling stock is low and thus they are managed as separate stocks. AFMA has management arrangements in place to constrain catches of the eastern stock to the eastern catch limit, although total catches of pink ling are managed under a single TAC.
Pink ling has been assessed using quantitative, model-based (tier 1) stock assessments since 2003. Although a number of versions of the model have been developed by different authors, SlopeRAG agreed to use a model developed by Cordue (Cordue, 2013) as the base-case model for providing advice (Georgeson et al, 2016a). The Cordue (2013) assessment was most recently updated in 2015 (Cordue, 2015). The updated assessment estimated the eastern stock biomass in 2015 to be 0.30 B0. Thus, for the eastern stock there is evidence that the stock is highly likely to be above PRI. The updated assessment (Cordue, 2015) estimated the western stock biomass in 2015 to be 0.72 B0. Accordingly, there is good evidence that the western stock is also highly likely to be above PRI.
Ribaldo
Ribaldo is assessed as a Tier 4 species, with the most recent assessment was revised in 2013 with CPUE data to 2012 (Haddon 2013b; in Helidoniotis et al, 2017a).
Helidoniotis et al (2016a) report that standardised CPUE has remained stable or increased and has remained above the target level for the last decade. On this evidence, it is highly likely that Ribaldo stocks remain above PRI.
CRITERIA: (ii) There is a strategy in place that is designed to maintain or to not hinder rebuilding of other species.
(a) Management strategy in place
| All gear types |
LOW RISK |
|
The following arrangements form the framework for the monitoring and management of main other species:
- SESSF Management Plan 2009
- SESSF Harvest Strategy Framework (AFMA, 2017)
- Commonwealth Policy on Fisheries Bycatch 2000
- Ecological Risk Assessments for the autolongline sector (AFMA, 2014a)
- SESSF Ecological Risk Management Strategy 2015 (AFMA, 2015c)
- Spatial closures to fishing under fisheries legislation, as well as closures under the South East Marine Protected Area network.
- Monitoring through logbooks and catch disposal records (CDRs)
- Monitoring through VMS; and
- Observer coverage (including e-monitoring).
Risks for the auto-longline fishery are well managed, with risks to teleost species from autolonglining assessed through an ERA and the outcomes considered in the SESSF ERM Strategy. Both main other species harvested by the fishery are managed individually as retained species within the SESSF, and are above the PRI. Dropline gear is highly selective, with 84% of the catch comprising Blue-eye Trevalla and no other species accounting for >5% of the catch. For power handline gear, while bronze whalers did comprise 6% of the total catch, the impact of this sector is accounted for in the assessment of cumulative impacts in the SESSF. The relatively low catch of the species by this gear type is not likely to hinder the recovery of the species.
Accordingly, for all three gear types, the measures in place constitute at least a partial strategy that is expected to maintain main other species at levels which are highly likely to be above PRI.
(b) Management strategy evaluation
| All gear types |
LOW RISK |
|
For autolongline gear, the outcomes of the ERA and periodic stock assessments of the main other species provide an objective basis for confidence that the measures in place will work and are being implemented successfully. For dropline/power handline gear, the highly selective nature of the gear and the very low catch rates of other species provide an objective basis for confidence that the measures in place will work.
| (c) Shark-finning |
MEDIUM RISK |
|
Shark finning at-sea is illegal in Commonwealth fisheries. All fisheries are subject to Fisheries Management Regulation 9ZO that makes it an offence for the caudal lobe, caudal fin, pectoral fin and dorsal fin to be removed from the shark at sea before it is in the possession of a fish receiver. No specific information was available on compliance rates with finning provisions. We have scored this SI medium risk on the basis that no observer coverage was recorded in the SHS in 2016-17 (Helidoniotis et al, 2017a) to allow for external validation of compliance.
CRITERIA: (iii) Information on the nature and amount of other species taken is adequate to determine the risk posed by the UoA and the effectiveness of the strategy to manage other species.
(a) Information
| All gear types |
LOW RISK |
|
The SHS sector of the SESSF is relatively data-rich, with quantitative information available to adequately assess the impact of the UoA on other species. Information includes:
- Level 1 and Level 2 PSA ERA (Webb et al. 2004);
- Level 3 SAFE ERA (Zhou et al. 2012);
- Residual Risk Assessment for teleost species in the autolongline sector (AFMA, 2014a);
- Ecological Risk Management Strategy for the Southern and Eastern Scalefish and Shark Fishery (AFMA 2015c).
- Logbook data, Catchwatch reports and reported landed data;
- Periodic assessments of main other species stock status;
- Observer reports through the ISMP (albeit no observer coverage was reported in the SHS sector in 2016-17).
These measures provide quantitative information that is sufficient to assess the impact of the UoAs on main other species with respect to status and to support measures to manage impacts.
PI SCORE – LOW RISK – Dropline, Longline
2B: Endangered Threatened and/or Protected (ETP) Species
CRITERIA: (i) The UoA meets national and international requirements for protection of ETP species.
The UoA does not hinder recovery of ETP species.
(a) Effects of the UoA on populations/stocks
Species assessed against this PI are those that:
- are listed as ETP species under the EPBC Act; OR
- are listed as ‘conservation dependent’ under the EPBC Act; OR
- are listed under relevant international agreements; and
- have been assessed as high risk or greater during the ERA process and have known interactions with the UoA.
ETP species interactions are required to be reported in fisher logbooks and reported quarterly on the AFMA website. Although observer records are likely to be a more accurate reflection of ETP species interactions, quantitative data on interactions with each gear type were not found. Accordingly, for this report, 12 Quarterly reports (i.e. 1 April 2014 to 31 March 2017) were assessed to determine the species and extent of interactions for the auto-longline, longline and dropline fisheries of the SESSF Gillnet Hook and Trap Sector (GHTS), noting that these data include longline fisheries that target both scalefish and sharks (i.e. a different sector).
Table 2 provides a summary of ETP interactions reported into logbooks for the 3-year period up to 31 March 2017. Of the 260 total interactions, 221 were from auto-longline shots. Mako sharks comprised more than half of all interactions (136), with seabirds around one-third (85). Longline interactions were relatively rare (31 total); almost half of the interactions comprised of great white sharks (9) and seals (6). There was one killer whale interaction during the last 3 years (auto-longline). The majority of reported interactions were mortalities. No separate data was available for power handline gear, although we have assumed that interactions in this sector are likely to similar or less than the dropline sector.
Table 2: Summary of reported ETP interactions from 1 April 2014 to 31 March 2017 (data source AFMA website).
| Gear | Killer Whale | Seal | Seabirds | Great White Shark | Porbeagle | Mako shark | Total |
| Auto-longline | 1 | 1 | 81 | 0 | 22 | 116 | 221 |
| Dropline | 0 | 0 | 0 | 0 | 0 | 8 | 8 |
| Longline | 0 | 6 | 4 | 9 | 0 | 12 | 31 |
| Total | 1 | 7 | 85 | 9 | 22 | 136 | 260 |
Three additional species / species groups are considered here as ETPs: Eastern Gemfish, upper slope dogfish and school shark, all of which are caught by the SHS, are currently considered overfished, and are subject to rebuilding strategies. In the case of Eastern Gemfish, although the stock considered as a Component 1 species in this assessment, would be considered an ETP species for the UoAs including Blue-eye Trevalla as the target species.
| Dropline |
LOW RISK |
Shortfin Mako (Low risk)
Shortfin mako is listed under the Convention on Migratory Species (CMS) and as a result was listed as ‘migratory’ under Australia’s EPBC Act in January 2010. While there are no international catch limits as a result of the CMS listing, the ‘migratory’ listing under the EPBC Act makes commercial targeting of this species an offence (albeit there are exemptions where species are taken as bycatch under accredited management plans [Bruce 2013]. For example, in the SESSF, any mako caught as bycatch and still alive when brought to the vessel must be released under these provisions; any specimen that is dead may be retained provided doing so does not contravene bycatch limits for sharks).
There is no information on the status of shortfin mako in relation to PRI, however the species was assessed as high risk in the Residual Risk analysis on the basis that “average annual logbook catch for this species 2001-2008 is approximately 2.4 t per year. This species was assessed under the Level 3 SAFE methodology and was found to be at High Risk, consequently, Residual Risk remains High.” Populations are declining throughout this species range.
The Gillnet, Hook and Trap sector of the SESSF has the second largest bycatch of mako sharks in Australian Commonwealth fisheries behind the Eastern Tuna and Billfish Fishery. For the period 2000 to 2006, the annual average mako shark captures for the entire SESSF was 2.36 t. These estimates are based on using available observer data and scaled, using the overall logbook effort data, to provide annual estimates.
Reference limits have been used to monitor the catch of Shortfin Mako. SharkRAG have set an upper reference limit of 5 t across all sector, intended to detect targeted fishing. Total catches in 2015-16 and 2016-17 were 1.6t and <0.5t respectively (SharkRAG, 2016).
While the effect of the UoAs on Shortfin Mako stocks is unknown, given the very low overall catch in the context of global catches (e.g. the Spanish pelagic longline fishery for swordfish and sharks is estimated to take between 600-700 t of shortfin makos; Mejuto et al. 2007 in Cailliet et al. 2009) it is likely the prohibition on targeting and monitoring through reference limits means the UoA is highly likely to not hinder recovery.
| Longline |
MEDIUM RISK |
The species below are considered on the basis of combined autolongline and longline ETP species interaction reports. These data are not separated into target species or depth range. Given longlines are used to target other species (e.g. sharks) in different areas, this may result in an over-representation of ETP species interactions. Should information more specific to the UoAs assessed here become available, this will be considered in future assessments.
Whales (Low risk)
The areas fished by the SESSF overlap with the distributions of several whale species, including killer whales. Entanglements between whales and gear types such as longlines, droplines, traps etc that use considerable lengths of rope do occur occasionally, and can result in mortality. Killer whale depredation of Blue-eye Trevalla is known to occur in the SHS fisheries, and it is believed to be so common that it affects commercial CPUE (SERAG, 2017). However, while the frequency of interaction could be considered high, only one mortality has been reported in the last three years. Orca is listed as a migratory species (i.e. not threatened or endangered). Given that only one mortality has been reported in three years, the fishery is highly likely to not hinder recovery of the species.
Fur Seals (Australian and New Zealand) (Low risk)
The areas fished by the SESSF overlap with the distributions of the Australian fur seal (Arctocephalus pusillus doriferus), New Zealand fur seal (A. forsteri) and Australian sea lion (Neophoca cinerea). Fur seal populations have recovered substantially following heavy harvesting in the 18th and 19th centuries, with conservative best estimates of current abundance of 87,424 (S.E. 10,415) published in 2016 (Mackay et al. 2016). Australian sea lions are currently listed under the EPBC Act as vulnerable and there is a formal recovery strategy in place under the EPBC Act (DSEWPC, 2013a). Interactions with both Australian and New Zealand fur seals were reported in the last three years for the SHS.
Mackay et al. (2016) estimated Potential Biological Removal (PBR), which is, conceptually, the maximum number of anthropogenic mortalities a marine mammal population can sustain while still allowing that “stock” to reach or maintain its optimum sustainable population. The method is sensitive to a range of recovery factors (RF) with estimates of PBR ranging from 2,623 to 4,721 for RF values of 0.5 to 0.9, respectively. In other words, the population could sustain human induced mortalities of at least 2,600 seals annually with a high degree of confidence in this measure.
Over 90% of the total effort in the SHS is auto-longline, and only 1 seal interaction has been reported during the past three years for that sub-fishery. While the rate of reporting is much higher in the longline sub-fishery (6 in 3 years), given the PBR of these species and the low effort in the longline sub-fishery, it appears highly likely that the effects of the SHS on the species will not hinder recovery.
Seabirds (Medium risk)
The use of auto-longlines in the SESSF Gillnet Hook and Trap Sector has raised concerns about the potential for interactions with seabirds, including albatrosses and shearwaters. New measures have been implemented to assist industry to meet the Seabird Threat Abatement Plan (TAP) (DoE, 2014a). The seabird TAP was first developed in 1998, then reviewed and updated in 2006 and 2014. In the SESSF, the criteria to meet this objective is a bycatch level of less than 0.01 birds per 1000 hooks. Reported mortality is significantly less than the national limit. No seabird species were scored high risk in the Residual Risk Assessment for non-teleost and non-chondrichthyan species, although a number were rated moderate risk (AFMA, 2012). The scoring for the Residual Risk Assessment reported that compliance with TAP measures amongst the autolongline sector was high. Helidoniotis et al (2017b) reported that the levels of seabird bycatch recorded by auto-longline, demersal longline, dropline and trotline operators in the SESSF are low compared with those in other pelagic longline fisheries that target tuna and billfish. Although species specific information on interactions in recent years was not found, the outcomes of the ERA (which took into account observer information) suggests that current rates of interaction are at least likely to not hinder recovery.
White Shark (Medium risk)
A recent study estimated the total size of the eastern Australian and New Zealand population of White Sharks to be 2,500–6,750 individuals (Hillary et al, 2018). This is the first estimate of total population size, so recent trends in status are unknown. White sharks are listed as vulnerable (and protected) under Commonwealth legislation, and the species is fully protected in the coastal waters of Tasmania, South Australia, Victoria and Western Australia; and protected in the coastal waters of New South Wales and Queensland with exemptions made for shark control measures for bather protection (e.g. beach meshing and/or drumlining) in these two states.
A Recovery Plan for white sharks was developed in 2002 and updated in 2013 (DSEWPC, 2013b). The plan aims to:
- improve the population status, leading to future removal of the white shark from the threatened species list of the EPBC Act; and
- ensure that anthropogenic activities do not hinder recovery in the near future, or impact on the conservation status of the species in the future.
Key actions are focused on better understanding trends in White Shark populations and monitoring and reducing interactions across all sectors, including commercial fishing. The plan was developed with the input of shark experts and relevant stakeholders. To that end, although there is uncertainty as to whether White Sharks are below PRI or whether the existing level of catch would hinder recovery, the SHS has measures in place expected to ensure the UoA does not hinder recovery.
Porbeagle (Low risk)
An average of 84kg of Porbeagle was retained annually in the Gillnet, Hook and Trap (GHAT) sector of the SESSF (which includes the SHS) between 2013 and 2015. While limited information is available on Porbeagle populations in the southern hemisphere (Stevens et al, 2018), the retained catch in the GHAT is orders of magnitude smaller than reported catches in other jurisdictions (e.g. New Zealand reported catch between 1998 and 2003 was between 150t and 300t per year). The current level of catch in the GHAT appears highly likely to not hinder recovery of this species.
School shark (Medium risk)
Recent genetic research (Hernández et al. 2015) supports the notion of a single New Zealand/Australia stock with a high level of connectivity within both New Zealand and Australian waters. This conclusion is supported by intensive tagging efforts.
School Shark is currently listed as overfished and it is uncertain whether overfishing is occurring (Marton and Koduah, 2017). Results from the most recent full quantitative assessment in 2009 estimated biomass levels to be below 20% of unfished levels although the assessment is uncertain. Marton and Koduah (2017) report that “in 2012, the 2009 assessment was rerun with additional catch data for the years 2009 to 2012 (Thomson 2012), specifically to estimate recovery timeframes for the stock under a range of future incidental catch levels and to investigate the impact of a proposed auto-longline fishery in South Australia. Under a zero catch scenario, the stock was projected to rebuild to 0.2B0 within 23 years, assuming that the gear selectivity and spatial and temporal distribution of catches are similar to that in 2011. At a constant catch of 250t, the stock was projected to rebuild to 0.2B0 in 80 years, and a catch of 275 t was projected to collapse the stock.”
Marton and Koduah (2017) also report that there may be signs that School Shark Biomass may be increasing. These include a preliminary index of abundance based on trawl CPUE, which estimates a generally increasing trend (Sporcic 2016; in Marton and Koduah, 2017), an increase in the catch of small sharks reported through the ISMP and preliminary results of survey work by the Institute for Marine and Antarctic Studies (IMAS) in school shark pupping areas off Tasmania indicate higher numbers of pups than during the 1990s (McAllister et al. 2015; in Marton and Koduah, 2017). Industry participants on SharkRAG have also reported signs of increasing availability of school shark, including increasing presence of juvenile school shark and increasing difficulty in avoiding school shark.
School Shark is subject to a current Rebuilding Strategy (AFMA, 2014b) which aims to rebuild the stock to the limit reference point of 20 per cent of unfished biomass within a biologically reasonable timeframe of three generation times (66 years). The Strategy allows for zero targeted fishing and sets TACs to allow for incidental catches taken while targeting gummy sharks. Currently the TAC is set at 215t. The plan also contains additional measures including:
- closures to all confirmed pupping grounds;
- closure of known school shark habitat through a blanket closure of all Victorian coastal waters and through the closure of specific school shark nursery areas in Tasmania;
- closure of waters deeper than 183m depth (gillnet closure); waters shallower than 183m (automatic longline); Kangaroo Island 1nm closure (gillnet, shark longline); Backstairs Passage closure (gillnet); 3nm Victor Harbour to the Victorian border (gillnet, shark longline); and the Tasmanian west coast 130m closure (gillnet and shark hook)
While there is uncertainty in the stock assessment and some discarding data, it is likely that the stock is below PRI. Nevertheless, there are a large range of measures in place that could be expected to ensure that the fishery does not hinder recovery. Catches are likely below the TAC accounting for discarding, and there appears to be some preliminary evidence of recovery. Accordingly, the unit of assessment meets the medium risk SG. However, given the difficulties in identifying a reliable indicator of abundance in recent years and the uncertainties in assessment, it is not clear that the recovery strategy has been demonstrably effective consistent with low risk or that the evidence of recovery is sufficient to meet low risk. Nevertheless, close kin genetic methods for estimating absolute biomass and IMAS surveys of school shark neonates in key nursery ground may provide demonstrable evidence of recovery in future.
Eastern Gemfish (Medium risk)
Eastern Gemfish are classified as overfished however the catch taken by autolongliners (around 5 t annually) is small in comparison to the 100t incidental catch limit in the rebuilding plan. On its own the autolongline catch is unlikely to hinder recovery.
Upper-slope Dogfishes (Gulper sharks) (Medium risk)
Upper-slope gulper sharks were targeted in the SESSF, GABTF and NSW trawl fisheries in the 1980s and 1990s and this resulted in the stocks being substantially depleted. Targeted fishing appeared to have effectively ceased in 2002, due to declining catch rates (Wilson et al. 2009), but very small quantities are still taken as byproduct (within trip limits).
Given the depleted state of the species (estimated to be <5–10 per cent of unfished levels on the upper slope off New South Wales, and unknown in other areas) the level of fishing mortality was considered too high to enable rebuilding, and three species of upper-slope gulper sharks (Harrison’s, Southern and Endeavour dogfish) were nominated for listing under the EPBC Act in 2008. The Endeavour Dogfish was found to be ineligible for listing in 2011 and consideration of the nomination of the other two species was extended until June 2012. In 2013, Harrison’s and Southern Dogfish were listed as ‘conservation dependent’ after meeting the eligibility Criterion for the ‘endangered’ listing. A rebuilding strategy is a requirement of the listing.
Helidoniotis et al (2017a) reported that:
- “AFMA released the draft Upper-Slope Dogfish Management Strategy in 2009, which protected several areas of known occurrence of dogfish, and implemented daily catch and trip limits (AFMA 2009b). The strategy was reviewed by Musick (2011) and found to be inadequate to ensure recovery of Harrisson’s, southern and endeavour dogfish, and greeneye spurdog, with fishing mortality still exceeding estimated sustainable levels. The strategy was subsequently revised in 2012, following research on depletion rates of upper-slope dogfish subpopulations (Williams et al. 2013), with a recovery objective of rebuilding Harrisson’s and southern dogfish stocks to 25 per cent of their original carrying capacity. Williams et al. (2013) examined the amount of core habitat area for Harrisson’s and southern dogfish that would be protected under a proposed closure network designed to meet this objective. Under the closure network, it is estimated that, in AFMA-managed waters, 25 per cent of the core habitat of Harrisson’s dogfish on the continental shelf and slope, 16.2 per cent of the core habitat of the eastern population of southern dogfish and 24.3 per cent of the core habitat of the central population of southern dogfish would be protected (from trawling and/or demersal longline fishing). These closures were implemented in February 2013. Additional closures were subsequently implemented on the Tasmanian seamounts (Queensland, Britannia and Derwent Hunter) overlaying the Murray and Freycinet Commonwealth marine reserves (areas that allow access to line fishing) (AFMA 2014b)”; and
- “Measures to further reduce fishing mortality include a combined trigger limit of three Harrisson’s dogfish and/or southern dogfish; a zero retention limit for greeneye spurdog, and Harrisson’s, southern and endeavour dogfish; and guidelines for handling practices. In 2014, a research and monitoring workplan was developed to establish methods for monitoring the rebuilding of dogfish abundance.”
It is also worth noting that post-capture survival is potentially high in the autolongline sector (subject to fishing gear soak time and handling practices) with a preliminary study by CSIRO estimating post-capture survival at 60–93 per cent for the 70 southern dogfish tagged and released in one study (Williams et al., 2013).
Helidoniotis et al (2017a) classified gulper sharks as overfished on the basis of substantial depletion of Harrisson’s and southern dogfish in areas of southern and eastern Australia and an absence of evidence to indicate the stock had recovered above the limit reference point. Moreover, they reported that “The level of reported catch (including discards) has declined over the past decade, and was very low in the 2015–16 and 2016–17 fishing seasons (<1 t and 0.3 t, respectively). However, there is potential for unreported or underestimated discards, based on the large degree of overlap of current fishing effort with the core range of the species. Low levels of mortality can pose a risk for such depleted populations. Although it has been estimated that the closures implemented in 2013 will protect 16.2–25 per cent of the core distribution areas of these species, no evidence has yet been obtained showing rebuilding, and the effect of the closures remains to be seen. As a result, gulper sharks are classified as uncertain with respect to the level of fishing mortality. Resolution of stock structure may result in one or more of the subpopulations being classified as not subject to overfishing.”
Based on the above, it is highly likely that gulper sharks are below PRI, however there are measures in place that could be expected to ensure that the UoA does not hinder recovery and rebuilding. No evidence is yet available to indicate recovery, nor that the strategy is yet demonstrably effective. Accordingly, the UoAs cannot score low risk.
CRITERIA: (ii) The UoA has in place precautionary management strategies designed to:
- meet national and international requirements; and
- ensure the UoA does not hinder recovery of ETP species.
| (a) Management strategy in place |
LOW RISK |
|
Under the Southern and Eastern Scalefish and Shark Fishery Management Plan 2003, AFMA is required to ensure that information is gathered about the impact of fishing on bycatch species and that all reasonable steps are taken to minimise incidental interactions with ETP species. ETP species that are identified as ‘high risk’ by the ERA are dealt with through the SESSF Ecological Risk Management Strategy (AFMA, 2015c). The Strategy is integrated into the management arrangements for the fishery, and incorporates the outcomes of the ERAs for the autolongline sector. Given the low impacts of the ever-reducing dropline sector, and the existing management measures for ETP interactions for the SESSF as listed below, there is limited need for separate bycatch and discarding plans for these sectors.
Fishers are required to take all reasonable steps to avoid interactions with protected species (other than those listed as ‘conservation dependent’) and report all interactions in their logbooks. An interaction is defined as any physical contact that a person, boat or gear has with a protected species, including catching and colliding with any of these species. AFMA reports all interactions with protected species recorded in logbooks to the Australian Government Department of the Environment and Energy on a quarterly basis and the information is made publicly available online. As long as operators are fishing in accordance with the accredited fishery management arrangements, it is not an offence to interact with a protected species. However, it is an offence for fishing operators not to report these interactions in their AFMA logbook. The level of logbook reporting is verified independently through observer coverage.
AFMA has developed management strategies and rebuilding strategies for some ETP species. These strategies outline management arrangements to minimise the impact of fishing on these species. The strategies involve unique management arrangements tailored to reducing interactions with each species. Arrangements can include things such as area closures, gear restrictions, monitoring requirements or trigger limits.
Strategies relevant to ETP species in this report include:
- Australian Sea Lion Management Strategy
- Seal Strategy (interaction management)
- Seabird Threat Abatement Plan
- School Shark Stock Rebuilding Strategy
- White shark recovery plan
- Upper slope dogfish recovery strategy
- Eastern Gemfish recovery strategy
Other strategies/plan relevant to ETP interactions by the UoA include:
- National Plan of Actions (Sharks) – Shark Plan 2
- Report on ‘Advice of the listing of CITES Appendix II sharks’
- SESSF Management Plan
- SESSF Ecological Risk Management Strategy
- Reference limits for high risk species to detect targeting and/or population decline.
Information is available through commercial catch and effort returns, independent observer coverage, ecological risk assessments and targeted studies.
Collectively, these measures form a strategy designed to meet national and international obligations, and to ensure the unit of assessment does not hinder the recovery of ETP species.
| (b) Management strategy implementation |
LOW RISK |
Requirements for fishermen to avoid interactions, ecological risk assessments, species specific analysis (e.g. school shark rebuilding, Eastern Gemfish recovery plan), observer information and compulsory logbook reporting demonstrating evidence of relatively low rates of interactions with most ETP species provide some objective basis for confidence that the strategy in place will work.
For example, in the case of school sharks, considerable species-specific modelling has been undertaken to predict recovery times based on alternative management strategies (e.g. Thomson, 2012; Huveneers et al, 2013). The most recent stock assessment (Thomson, 2012) found that School Shark would not rebuild to 20% of unfished level (Blim) in 32 years even if fishing mortality was zero. As such, the new Rebuilding Strategy (2014) stipulates the new rebuilding timeframe, with an annual mortality of 215 t to recover biomass to above Blim in 66 years (three generation times). Despite uncertainties, modelling indicates that the recovery plan should achieve its targets. Some evidence of stock recovery also exists, albeit preliminary, through IMAS neonate surveys in key nursery areas.
In the case of gulper sharks, recent assessments indicate that the recovery strategy has at least arrested the population decline.
CRITERIA: (iii) Relevant information is collected to support the management of UoA impacts on ETP species, including:
- information for the development of the management strategy;
- information to assess the effectiveness of the management strategy; and
- information to determine the outcome status of ETP species.
| (a) Information |
LOW RISK |
|
The primary sources of information on ETP species interactions include compulsory commercial fisher reporting in logbooks, observer coverage through the ISMP and targeted studies on specific species (e.g. school sharks, upper slope dogfishes). Catch and effort information is also available for commercially important ‘conservation dependent’ listed species (e.g. Eastern Gemfish).
To assist fishers accurately identify protected species, AFMA has produced the following guides:
- Protected species identification guide
- Shark and Ray eBook
- Seabird identity guide
The rate of observer coverage has varied in the past few years from 78 fishing days in the autolongline sector in 2014-15, to 12 fishing days in 2015-16, to zero coverage in 2016-17. Onboard cameras are being trialled in some SESSF fisheries as a way of monitoring bycatch of ETP species and may be used to gather information; however this work is subject to further trials.
Information available on the distribution of ETP species within the fishery area, together with information on their biological characteristics and rates of interaction through logbooks and the ISMP, has allowed an assessment of the likely impacts on ETP species through ecological risk assessments. Three types of ecological risk assessments have been undertaken in this fishery (e.g. AFMA, 2012; AFMA, 2014a). ERAs have focused on the autolongline sector, which is likely to have the highest rates of effort and interaction. Specific ERAs have not been completed for the dropline and power handline sectors, although rates of interaction are thought to be low.
For several ETP species, detailed quantitative information is available modelling population dynamics, current status and likely recovery times (e.g. Australian Fur seals, School Sharks, Eastern Gemfish, upper slope dogfish).
In general, at least some level of quantitative information is available on ETP species interactions which has been adequate to assess likely UoA related mortality through the ERA process or more detailed quantitative analyses, and to support strategies to manage impacts. Accordingly, we have scored this SI low risk. Nevertheless, we note the decline in observer coverage over the past few years, with nil coverage in the autolongline sector in 2016-17. Given the potential for under-reporting of ETP species interactions in fisher logbooks, the absence of observer coverage on an ongoing basis (without some replacement mechanism to monitor interactions), may limit the ability to assess impacts and detect increased risk.
PI SCORE – LOW RISK – Dropline, Longline
2C: Habitats
CRITERIA: (i) The UoA does not cause serious or irreversible harm to habitat structure and function, considered on the basis of the area(s) covered by the governance body(s) responsible for fisheries management
| (a) Habitat status | ||
Examples of “serious or irreversible harm” to habitats include the loss (extinction) of habitat types, depletion of key habitat forming species or associated species to the extent that they meet criteria for high risk of extinction, and significant alteration of habitat cover/mosaic that causes major change in the structure or diversity of the associated species assemblages (MSC, 2014). Further, MSC specifies that if a habitat extends beyond the area fished then the full range of the habitat should be considered when evaluating the effects of the fishery. The ‘full range’ of a habitat shall include areas that may be spatially disconnected from the area affected by the fishery and may include both pristine areas and areas affected by other fisheries.
| Dropline/Power handline |
LOW RISK |
Droplines and power handlines are considered “passive” gear types, with the risk to benthic habitats being minimal/negligible. Line weights can disturb sediments and move rocks although the footprint of disturbance is usually negligible in the context of the habitat encountered. Although the impact of dropline/power handline gear has not been investigated in detail in the SESSF, there is a plausible argument that the very low levels of effort in these sectors, the small footprint of the gear and the generally benign nature of the gear type means that this unit of assessment is probably highly unlikely to reduce habitat structure and function to the point of serious of irreversible harm.
| Longline |
MEDIUM RISK |
A habitat risk assessment has been conducted for the SESSF that includes the Scalefish Hook Sector (Hobday et al. 2011). Of the 149 habitat types assessed, 17 were assessed to be at high risk, 98 medium, and 34 low. Of the high risk habitats, 2 were on the outer shelf (100-200 m) and 15 on the upper slope (200-700 m) (Hobday et al. 2011). AFMA (2015c) noted that “there are several habitat types that are at least potentially at risk from automatic longline fishing. A key uncertainty is the effect of movement of the main line itself on large, erect and fragile epifauna. Areas closed to fishing are likely the most effective way to mitigate risk from fishing.”
All areas shallower than 183m are closed to auto-longlining, while representative areas of biodiversity have been closed to fishing under the Commonwealth South East Marine Protected Areas (SE MPAs). The extent to which the auto-longline sector interacts with high risk habitats on the upper slope does not appear to have been further investigated following the Level 2 risk assessment, although the array of closures in place and the relatively benign nature of longline fishing suggests it is at least unlikely that the UoA would reduce habitat structure and function to the point of serious or irreversible harm.
CRITERIA: (ii) There is a strategy in place that is designed to ensure the UoA does not pose a risk of serious or irreversible harm to the habitats.
(a) Management strategy in place
| All sectors |
LOW RISK |
|
The management ‘strategy’ relevant to habitats consists of mapping habitats, using ERAs to identify high risk activities over sensitive habitats, closing areas and depth zones, and using VMS to monitor interactions.
Seabed habitat mapping within the SESSF is extensive (Williams et al., 2006), and the ERAEF report (Hobday et al. 2007) concluded that spatial management (specific spatial closures) may be an appropriate way to protect vulnerable habitats from the impacts of all gear types in the UoA region. Depth closures implemented to protect school and gummy shark stocks have indirectly afforded protection to this vulnerable habitat.
There are fourteen marine reserves in the South-east that are managed under the South-east Commonwealth Marine Reserves Network Management Plan 2013-23[1]. This Management Plan sets out the zoning, allowable activities and rules for use within South-east marine reserves until 2023. Commercial fishing is prohibited in most zoning types.
There are also a series of depth closures in the fishery to aid School shark recovery, and upper slope dogfish recovery, and these may indirectly afford some level of habitat protections. These measures are likely to be considered at least a partial strategy that is expected to achieve the criterion in 2C(i).
[1] http://www.environment.gov.au/topics/marine/marine-reserves/south-east
(b) Management strategy implementation
| Dropline/Power handline |
LOW RISK |
For the dropline/power handline sectors, the benign nature of the gear type together with the very limited spatial footprint of the fishery provides some objective basis for confidence that the measures in place will avoid serious or irreversible harm to the main habitats encountered. Although the sectors have been subject to limited analysis in the context of habitat impacts, quantitative evidence of low levels of fishing effort and spatial footprint of the fishery are available from logbook and VMS information.
| Longline |
MEDIUM RISK |
For the auto-longline sector, the existing closures in place could be considered likely to work based on plausible argument, although additional analysis of the footprint of the fishery over the high-risk habitats identified through the ERA process may be required to meet the low risk SG. Given the VMS data available and the habitat mapping available in the South-East area, we expect this could be achieved.
CRITERIA: (iii) Information is adequate to determine the risk posed to the habitat by the UoA and the effectiveness of the strategy to manage impacts on the habitat.
(a) Information quality
| All sectors |
LOW RISK |
|
The nature, distribution and vulnerability of the main habitats in the UoA are known. Habitat information in the SESSF has been collected by Bax & Williams (2001) and Williams et al. (2006), and habitats impacts for other sectors within the SESSF (e.g. CTS) have been investigated in detail (e.g. Pitcher et al, 2015). The ERA (Level 2 PSA) identified the presence of vulnerable habitat types that occur in the region of the UoA. VMS information on the spatial extent of fishing and periodic observer coverage provides detect increased risk from the fishery.
(b) Information and monitoring adequacy
| All sectors |
MEDIUM RISK |
Information through ERAs, observer information and habitat mapping (e.g. Williams et al, 2006) is sufficient to detect the main impacts on the main habitats. VMS and logbook data and observer information on gear usage provide reliable information on the spatial extent of the fishery, although the overlap between current effort and high risk habitats does not appear to have been analysed.
PI SCORE – LOW RISK – Dropline
PI SCORE – MEDIUM RISK – Longline
2D: Ecosystems
CRITERIA: (i) The UoA does not cause serious or irreversible harm to the key elements of ecosystem structure and function.
(a) Ecosystem Status
| All sectors |
LOW RISK |
|
Serious or irreversible harm in the ecosystem context should be interpreted in relation to the capacity of the ecosystem to deliver ecosystem services (MSC, 2014). Examples include trophic cascades, severely truncated size composition of the ecological community, gross changes in species diversity of the ecological community, or changes in genetic diversity of species caused by selective fishing.
The risks that the SHS sectors pose to the sustainability of the marine ecosystems in which it operates have been investigated through a series of Ecological Risk Assessments. The Ecological Risk Assessment for the Effects of Fishing (ERAEF) employed for the fishery was a four-step process:
- Level 1 analysis (SICA – Scale Intensity Consequence Analysis) (Webb et al. 2004);
- Level 2 analysis (PSA – Productivity Susceptibility Analysis);
- Level 2 analysis (Residual risk PSA);
- Level 3 analysis (SAFE – Sustainability Assessment for Fishing Effects) (Zhou et al. 2007; 2012);
In addition to these assessments, an ERA extension to assess cumulative effects of fishing on species (Zhou et al. 2013) was completed.
The Level 1 SICA ERA (Webb et al. 2004) examined 5 community units for each sector and found no communities to be at high risk. These outcomes are sufficient to provide a plausible argument that the UoAs are at least unlikely to disrupt the key elements of the ecosystem.
Gear loss occurs very infrequently. The fishery management plan requires operators to take all reasonable steps to minimise loss of gear, and a longline can be retrieved from the other end if a buoy-line or longline breaks. If both ends break, the line can be located using GPS and retrieved using grapnels. The total area affected compared with the range of the fishery is small (< 1 nm2) (Webb et al., 2004). Despite some uncertainty in the impacts of auto-longline on sensitive habitats, on balance the SHS appears to pose minimal risk to the structure and function of the ecosystem.
CRITERIA: (ii) There are measures in place to ensure the UoA does not pose a risk of serious or irreversible harm to ecosystem structure and function.
| (a) Management strategy in place |
LOW RISK |
|
The UoA has a number of measures in place to restrain impacts on the ecosystem. These include:
- Harvest strategies for the target stock and some non-quota species;
- Gear restrictions;
- Spatial closures (including representative Marine Protected Areas);
- Ongoing monitoring (observer coverage and logbook assessment);
- Seabed mapping project in collaboration with fishers to identify the vulnerable habitats;
- Research and modelling into the trophic ecology of southern Australia;
- Periodic ecological risk assessments.
Spatial closures to all hook operations provide a refuge for species and their habitat from the effects of fishing. A series of spatial closures have been developed in south eastern Australia and the SESSF Management Booklet sets out those relevant to the SESSF[1].
All reports and ERAs are available on the AFMA website. While the majority of ecological risk management actions implemented to date have been species based, future reviews of the Ecological Risk Assessment process is expected to expand in focus to include impact on marine habitats and communities that may be impacted by fishing. These measures constitute at least a partial strategy that is expected to restrain impacts of the SHS on the ecosystem so as to achieve the criterion in 2D(i).
[1] http://www.afma.gov.au/wp-content/uploads/2017/04/SESSF-Management-Arrangement-Booklet-2017.pdf
[1] http://www.afma.gov.au/wp-content/uploads/2017/04/SESSF-Management-Arrangement-Booklet-2017.pdf
| (b) Management strategy implementation |
LOW RISK |
|
The risks that the SHS poses to the sustainability of the marine ecosystem have been assessed through the application of a progression of risk assessment methodologies (ERAEF process outlined in 2D(i)). The results of the level 1 ERA provide some objective basis for confidence that the measures in place will work at the community level, and catches of the main target species have been below their RBCs in recent years (except for school sharks which is managed as an incidental catch). The impacts on individual species identified as high risk are addressed through a series of targeted measures (e.g. rebuilding plans, bycatch action plans, spatial closures, etc). Some evidence is available through stock assessments, ETP species monitoring and ERAs that these measures are being implemented successfully.
CRITERIA: (iii) There is adequate knowledge of the impacts of the UoA on the ecosystem.
| (a) Information quality |
LOW RISK |
|
There has been significant investment in research for the fishery in all elements of the ecosystem, including species (target, byproduct, ETP), habitats and ecosystems. While these information sources vary in detail and progression of knowledge, they have been collected in a manner that provides a sound understanding of these key ecosystem elements and allows for detection of changes in risk.
The Marine Bioregional Plan for the Temperate East Marine Region 2012 and the Marine Bioregional Plan for the South-east Marine Region 2012 identify a number of key ecological features present in the area of the SESSF, including the SHS. A considerable amount of relevant biological and ecological information has been assembled to support these plans (see for example, Bulman and Fulton, 2015 and other reports on the relevant marine reserves websites[1]).
[1] http://www.environment.gov.au/topics/marine/marine-reserves/south-east/resources; http://www.environment.gov.au/topics/marine/marine-reserves/temperate-east/resources
| (b) Investigations of UoA impact |
LOW RISK |
|
The main impacts of the fishery on the ecosystem can be inferred from existing information, and will largely include impacts associated with the removal of the target species, as well as ETP impacts. The impacts of the SHS on some key elements have been investigated in detail (e.g. Level 3 SAFE assessments).
PI SCORE – LOW RISK – Dropline, Longline
COMPONENT 3: Management system
3A: Governance and Policy
CRITERIA: (i) The management system exists within an appropriate and effective legal and/or customary framework which ensures that it:
- Is capable of delivering sustainability in the UoA(s); and
- Observes the legal rights created explicitly or established by custom of people dependent on fishing for food or livelihood.
| (a) Compatibility of laws or standards with effective management |
LOW RISK |
|
Relevant Australian Commonwealth Acts, subsidiary legislation and cooperative instruments, including the EPBC Act 1999, Fisheries Management Act (FMA), Fisheries Administration Act (FAA) provide an effective legal framework for the purposes of delivering management outcomes consistent with Components 1 and 2. The FMA takes account of the United Nations Fish Stocks Agreement and FAO’s Code of Conduct for Responsible Fisheries.
| (b) Respect for Rights |
LOW RISK |
|
The management system has a mechanism to formally commit to the legal rights created explicitly or established by custom on people dependent on fishing for food and livelihood. The Commonwealth Native Title Act 1993 formally commits to the rights of indigenous people who can demonstrate their customary rights to fish in a particular area. This legislation provides a mechanism for the making of binding decisions about native title rights to areas of land and water and thereby ensures access to fish resources for people who depend on fishing for their food. AFMA’s jurisdiction typically begins three nautical miles offshore, thus, there is usually no overlap between Commonwealth commercial fishing and customary fishing activity. However, for some fisheries, consideration of customary fishing is largely made through interaction between AFMA’s management and the Native Title Act 1993. Where AFMA modifies an act, a direction or other legislative instrument in a way that may affect native title, that change triggers the ‘future act’ provision of the Native Title Act 1993. In situations where a future act provision could possibly be triggered, AFMA provides the opportunity for relevant native title bodies to be consulted and provide comment. In addition, Fisheries Legislation Amendment (Representation) Bill 2017 is currently before the Commonwealth parliament. The Bill provides for explicit recognition of recreational and Indigenous fishers in Commonwealth legislation and requires AFMA to have regard to ensuring that the interests of all fisheries users are taken into account in Commonwealth fisheries management decisions[1].
Given the above, the management system has a mechanism to observe the legal rights created explicitly or established by custom of people dependent on fishing for food or livelihood.
[1] http://www.aph.gov.au/Parliamentary_Business/Bills_Legislation/bd/bd1617a/17bd090
CRITERIA: (ii) The management system has effective consultation processes that are open to interested and affected parties. The roles and responsibilities of organisations and individuals who are involved in the management process are clear and understood by all relevant parties.
| (a) Roles and Responsibilities |
LOW RISK |
|
All stakeholders involved in the management process of the UoA are identified. The functions, roles and responsibilities are explicitly defined and comprehensively understood.
AFMA undertakes the day-to-day management of the Commonwealth fisheries under powers outlined in the FMA and Fisheries Administration Act 1991. Overarching policy direction is set by the Australian Government through the relevant Minister responsible for fisheries, acting upon advice from the Australian Government Department of Agriculture (DoA). The DoA (formerly the Department of Agriculture, Fisheries and Forestry, DAFF) plays an important policy role in promoting the biological, economic and social sustainability of Australian fisheries, particularly those managed by the Australian Government. The department provides policy advice to the Australian Government on a range of fisheries environmental issues, including general fisheries bycatch, seals and sealions, seabirds and the conservation and management of sharks.
The Australian Government Department of the Environment develops and implement policies that protect and conserve the marine ecosystems and biodiversity while maintaining a profitable, competitive and sustainable fishing industry. This includes contributing to the marine bioregional planning process and contributing to policy for the management of a range of marine species.
There is a Management Advisory Committee (SEMAC) and Resource Assessment Group (SERAG) relating to the SESSF. Ecological sustainability is mentioned within the Act, and the SESSF has been evaluated under various Ecological Risk Assessments, and Wildlife Trade Operation declaration (EPBC Act).
| (b) Consultation Process |
LOW RISK |
|
The management system includes consultation processes that regularly seek and accept relevant information, including local knowledge. The management system demonstrates consideration of the information and explains how it is used or not used. South East Management Advisory Committee (SEMAC) is the main advisory body to AFMA. The MAC provides advice on a variety of issues including fisheries management arrangements, research, and compliance/management costs. The MAC also provide a link between AFMA and those with an interest in the fishery, with membership generally comprising members from commercial industry, fisheries management, the scientific community, the environment/conservation sector and, in some instances, the State governments.
Under the FMA, ‘plans of management’, or fisheries management plans (FMPs) as they are known, are the way arrangements are set for each fishery. The FMA establishes the FMPs as the main mechanism for managing fisheries and hence they are the main mechanism for giving effect to the objectives of the FMA. The FMA requires consultation with the public on draft FMPs and provides for ministerial oversight.
Under the Act, AFMA must set out in writing a FMP for each fishery or, likewise in writing, explain why one is not needed and provide draft plans for public display so interested persons can make representations. In other respects, the Act sets out various things that a plan must, or may, contain, and similarly, what AFMA must, or may, do in relation to performing its functions under a FMP.
CRITERIA: (iii) The management policy has clear long-term objectives to guide decision making that are consistent with the outcomes expressed by Components 1 and 2, and incorporates the precautionary approach.
| (a) Objectives |
LOW RISK |
|
The long-term objectives of the management system are specified in the FMA and the EPBC Act, and further defined in the Commonwealth Fisheries Harvest Strategy Policy and Guidelines. The objectives and policy guidance are consistent with the outcomes expressed by Components 1 and 2 and explicitly require application of the precautionary principle. The fishery is also subject to the Commonwealth EPBC Act, which requires periodic assessment against the Guidelines for the Ecologically Sustainable Management of Fisheries. These Guidelines encourage practical application of the ecosystem approach to fisheries management.
PI SCORE – LOW RISK
3B: Fishery Specific Management System
CRITERIA: (i) The fishery specific management system has clear, specific objectives designed to achieve the outcomes expressed by Components 1 and 2.
| (a) Objectives |
LOW RISK |
|
Well defined and measurable short and long term objectives, which are demonstrably consistent with achieving the outcomes expressed by Components 1 and 2, are explicit within the fishery’s management system. The SESSF Management Plan 2003 (amended in 2009) reinforces the objectives of the FMA as the objectives of the Plan. These are consistent with Australia’s obligations under international arrangements, national legislation and specifically require application of the precautionary principle. Fishery specific objectives are set out in the SESSF Harvest Strategy.
CRITERIA: (ii) The fishery specific management system includes effective decision making processes that result in measures and strategies to achieve the objectives.
| (b) Decision making |
LOW RISK |
|
The decision-making process for the SESSF responds to the defined harvest and bycatch management strategies, which respond to research, outcomes evaluations and monitoring programs. The decision-making processes by AFMA based on advice from SEMAC, working with SERAG are transparent with feedback provided by the Commission directly to SEMAC and to stakeholders through media such as the regular AFMA Update and through the Annual public meeting of AFMA.
There is evidence that the management system has responded to serious or other issues identified through stock assessments, ERAs and other species-specific analysis, e.g. the establishment and refinement of the school shark rebuilding strategy.
| b) Use of the Precautionary approach |
LOW RISK |
The objectives and policy guidance of the SESSF explicitly require application of the precautionary principle. The fishery is also subject to the Commonwealth EPBC Act, which requires periodic assessment against the Guidelines for the Ecologically Sustainable Management of Fisheries (for export approval). These Guidelines and encourage practical application of the ecosystem approach to fisheries management. The ERA methodology also accounts for uncertainty by being precautionary.
| (c) Accountability and Transparency |
LOW RISK |
|
The AFMA website contains an extensive list of evaluations, research reports and assessments, and evidence exists within the SEMAC, the SERAG that decisions respond to these findings. Meeting minutes are also available online. AFMA provide monthly and annual reports, which outline program outcomes and, provide a means for measuring success. Reported ETP species interactions are summarised online.
CRITERIA: (iii) Monitoring, control and surveillance mechanisms ensure the management measures in the fishery are enforced and complied with.
| (a) MCS Implementation |
LOW RISK |
|
AFMA’s framework for its National (Domestic) Compliance and Enforcement Program is set out in the AFMA National Compliance Operations and Enforcement Policy (AFMA, 2015e). The policy is compliant with the Australian Fisheries National Compliance Strategy 2010-15 and aims to “effectively deter illegal fishing in Commonwealth fisheries and the Australian Fishing Zone”. Compliance activities are informed by risk assessments undertaken in accordance with the international standard for risk management (ISO 31000:2009) across all major Commonwealth domestic fisheries (AFMA, 2015e). Compliance operations are supported through a centralised structure with separate Intelligence, Planning and Operations units.
More specific annual compliance priorities and risk treatments are set out in AFMA’s National Compliance and Enforcement Program 2016 -17 (AFMA, 2015f). Key priorities for 2016-17 include (i) failure to have a Vessel Monitoring System (VMS) or Electronic Monitoring (emonitoring) system operating at all times, (ii) quota evasion and (iii) bycatch mishandling, which has been identified as an emerging risk. Risks are treated through a program of general deterrence (i.e. inspections and patrols designed to target identified high risk ports, boats and fish receivers), and other targeted measures – e.g. physical and technical surveillance, standard investigative activity, intelligence gathering, and media strategies. Compliance Risk Management Teams (CRMTs) may be formed to help address priority risks (e.g. VMS/electronic monitoring offences; quota evasion).
These measures constitute a system which has demonstrated an ability to enforce management measures.
| (b) Sanctions and Compliance |
LOW RISK |
|
A framework of sanctions for non-compliance is set out in the FMA, Maritime Powers Act 2013 and Fisheries Management Regulations 1992. These include powers to issue warnings, cautions, directions, Observer Compliance Notices, Commonwealth Fisheries Infringement Notices (CFINs), amend fishing concession conditions, suspend or cancel fishing concessions and prosecute offenders through the courts (AFMA, 2015e). Some evidence exists that fishers comply with the management system including providing information of importance to the effective management of the fishery. Across all years between 2011-12 and 2015-16, no action was required in >90% of boat inspections in Commonwealth fisheries (total inspections 879) (AFMA, 2015f).
| (c) Systematic non-compliance |
LOW RISK |
There appears to be no evidence of systematic non-compliance.
CRITERIA: (iv) There is a system for monitoring and evaluating the performance of the fishery specific management system against its objectives.
| (a) Evaluation coverage |
LOW RISK |
|
Performance of all stocks against the SESSF Harvest Strategy are assessed annually through the RAG and MAC process. TACs are adjusted annually based on updated stock assessments and RAG/MAC/AFMA advice. Periodic updates of ERAs evaluate performance against environmental objectives and guide management priorities. Fishery Status Reports produced annually by the Australian Bureau of Agricultural and Resource Economics and Sciences (ABARES) provide an independent evaluation of key parts of the management system (e.g. stock status, overfishing status). In addition, two Australian National Audit Office reviews have been undertaken into the domestic compliance program (2009, 2013). Accordingly, the fishery has measures in place to evaluate key parts of the management system.
| (b) Internal and/or external review |
LOW RISK |
|
The fishery-specific management system is subject to regular internal review through the SEMAC process, which tracks performance of the fishery against the objectives in the Management Plan. AFMA is also required to report in its Annual Report on overall performance against the legislative objectives, statutory requirements and financial reporting, the effectiveness of internal controls and adequacy of the Authority’s risk management processes.
The fishery is subject to regular external assessment through the ongoing assessment for export approval under the EPBC Act against the Guidelines for the Ecologically Sustainable Management of Fisheries.
PI SCORE – LOW RISK
Acknowledgements
This seafood risk assessment procedure was originally developed for Coles Supermarkets Australia by MRAG Asia Pacific. FRDC is grateful for Coles’ permission to use its Responsibly Sourced Seafood Framework.
It uses elements from the GSSI benchmarked MSC Fishery Standard version 2.0, but is neither a duplicate of it nor a substitute for it. The methodology used to apply the framework differs substantially from an MSC Certification. Consequently, any claim about the rating of the fishery based on this assessment should not make any reference to the MSC.