
Sea Mullet – Queensland East Coast Inshore Fin Fish Fishery
Assessment Summary
Sea Mullet
Unit of Assessment
Product Name: Sea Mullet
Species: Mugil cephalus
Stock: Sea Mullet – Eastern Australian
Gear type: Mesh net, Beach seine
Fishery: Queensland East Coast Inshore Fin Fish Fishery
Year of Assessment: 2017
Fishery Overview
The Queensland East Coast Inshore Fin Fish Fishery (ECIFFF) is a geographically widespread, multi-species, multi-gear fishery ranging from the Qld/NSW border to the tip of Cape York (Figure 1). The ECIFFF comprises commercial, recreational, charter and Indigenous sectors. The commercial sector is Queensland’s fourth most valuable commercial fishery (based on estimated GVP), targeting a number of finfish species, using a variety of different net fishing methods. Some species are also taken commercially by hook and line.
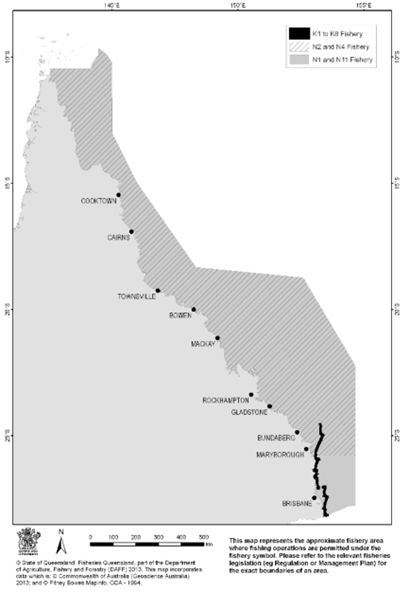
Figure 1: Queensland net fishing areas. (Source: DAFF, 2014a)
The management arrangements governing the commercial sector are a complex array of limited entry (via the allocation of fishery symbols), restrictions on gear type (e.g. mesh sizes, net length), spatial closures under both fisheries and marine parks (State and Commonwealth) legislation and temporal restrictions (e.g. closed season on Barramundi, weekend closures). Competitive total allowable catches (TACs) have also been established for some species (e.g. Tailor, Spotted Mackerel, sharks, Grey Mackerel).
The fishery is subject to intense competition for resources with the recreational sector who dominate the catches of most ‘bread and butter’ species, such as Tailor, Yellowfin Bream and Dusky Flathead.
The fishery has recently been subject to a $10m license buyout aimed at removing fishery symbols capable of using large mesh nets.
More detailed summaries of the fishery are provided in DAFF (2014a) and at https://www.daf.qld.gov.au/fisheries/monitoring-our-fisheries/data-reports/sustainability-reporting/queensland-fisheries-summary/east-coast-inshore-fin-fish-fishery
Two separate ‘units of assessment’ are examined in this report:
- Sea Mullet taken with mesh nets in the ECIFFF
- Sea Mullet taken with beach seine in the ocean beach (‘K’ symbol) sector of the ECIFFF
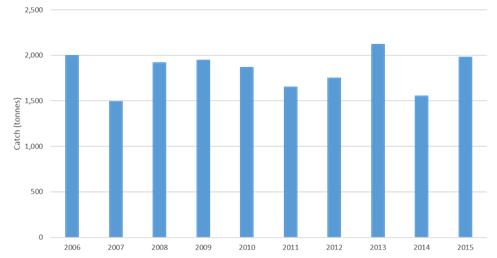
Figure 2 Trends in Total Catch of Sea Mullet in the ECIFF
Risk Scores
|
Performance Indicator |
Sea Mullet – |
Sea Mullet – |
|
COMPONENT 1 |
MEDIUM RISK |
MEDIUM RISK |
|
1A: Stock Status |
MEDIUM RISK |
MEDIUM RISK |
|
1B: Harvest Strategy |
PRECAUTIONARY HIGH RISK |
PRECAUTIONARY HIGH RISK |
|
1C: Information and Assessment |
MEDIUM RISK |
MEDIUM RISK |
|
COMPONENT 2 |
HIGH RISK |
LOW RISK |
|
MEDIUM RISK |
LOW RISK |
|
|
2B: ETP Species |
HIGH RISK |
MEDIUM RISK |
|
2C: Habitats |
LOW RISK |
LOW RISK |
|
2D: Ecosystems |
LOW RISK |
LOW RISK |
|
COMPONENT 3 |
MEDIUM RISK |
MEDIUM RISK |
|
3A: Governance and Policy |
LOW RISK |
LOW RISK |
|
3B: Fishery-specific Management System |
MEDIUM RISK |
MEDIUM RISK |
Summary of main issues
- The most recent quantitative stock assessment conducted for Sea Mullet was in 2005. Considerable latent effort exists in the commercial sector across both main jurisdictions harvesting the stock (Queensland and NSW);
- Despite substantial improvements in the management and monitoring of commercially fished shark species since 2009, weaknesses in the information base limit the capacity to undertake robust stock assessments. The nature of the TAC, which covers all species of sharks and rays, provides limited species specific control;
- There are no well-defined harvest control rules in place to reduce exploitation as the point of recruitment impairment is approached for any of the assessed target stocks;
- There is no independent monitoring of catch composition including discards;
- The ECIFFF has the potential to interact with a large number of ETP species. At present, there is no mechanism to independently validate Species of Conservation Interest (SOCI) logbook reporting. Uncertainties exist in the rates of interaction with some ETP species (e.g. inshore dolphins, Sawfish, protected sharks).
- The fishery appears well-placed against habitat and ecosystem PIs.
Outlook
Sea Mullet – Mesh net
| Component | Outlook | Comments |
| Target species | Improving | Significant reform processes are underway in both main jurisdictions harvesting Sea Mullet. In Queensland, a harvest strategy with well-defined harvest control rules will be developed by 2018 as part of the Queensland Government’s Queensland Sustainable Fisheries Strategy 2017-2027. In NSW, the Commercial Fisheries Business Adjustment Program will address excess fishing capacity by linking shares to catch or effort. |
| Environmental impact of fishing | Improving | The implementation of the Queensland Government’s commitment to introduce harvest strategies with well-defined harvest control rules for inshore fisheries by 2018, together with improved data collection, independent validation of commercial fisher logbooks and regular ecological risk assessments is likely to improve risk scoring for non-target species and possibly for ETP species. |
| Management system | Improving | A range of improvements to the management system is proposed as part of the Queensland Sustainable Fisheries Strategy 2017-2027, including strengthened stakeholder engagement, measures to strengthen compliance and measures to evaluate the performance of the management system (e.g. through monitoring against harvest strategies). |
Sea Mullet – Beach seine (Ocean Beach fishery)
| Component | Outlook | Comments |
| Target species | Improving | Significant reform processes are underway in both main jurisdictions harvesting Sea Mullet. In Queensland, a harvest strategy with well-defined harvest control rules will be developed by 2018 as part of the Queensland Government’s Queensland Sustainable Fisheries Strategy 2017-2027. In NSW, the Commercial Fisheries Business Adjustment Program will address excess fishing capacity by linking shares to catch or effort. |
| Environmental impact of fishing | Stable | Risks are likely to remain relatively stable, although improvements may result from the Queensland Government’s commitment to improved data collection, monitoring and independent validation of commercial fisher reporting. |
| Management system | Improving | A range of improvements to the management system are proposed as part of the Queensland Sustainable Fisheries Strategy 2017-2027, including strengthened stakeholder engagement, measures to strengthen compliance and measures to evaluate the performance of the management system (e.g. through monitoring against harvest strategies). |
Complete Report
COMPONENT 1: Target fish stocks
1A: Stock Status
CRITERIA: (i)The stock is at a level which maintains high productivity and has a low probability of recruitment overfishing.
(a) Stock Status
| Sea Mullet |
MEDIUM RISK |
|
Extensive tagging studies suggest a single east coast biological stock of Sea Mullet, extending from central Queensland to eastern Victoria (Stewart et al, 2016).
The most recent quantitative assessment of the stock occurred in 2005, using data to 2002 (Bell et al. 2005). The assessment found that the stock has been heavily exploited since the fishery’s introduction more than 100 years ago, with recruitment highly variable. Point estimates of biomass at that time were uncertain but “clearly less than 60% of the virgin level”.
In recent years, both Queensland and NSW have assessed the stock using a ‘weight of evidence’ approach, based on catch, nominal catch rates and age and size composition of the commercial catch.
Stewart et al (2016) report that:
- “The Queensland component of the Eastern Australian biological stock has a long history of stable commercial landings. In 2015, 1982 t was reported landed, which is close to the long-term average of around 2000 t. Length frequency information from routine monitoring shows stable distributions of fish sizes harvested by the Queensland fishery. Age frequency information shows fish from three to five years old dominate catches, but older fish are present. Recruitment has been consistent, with evidence of recent strong year classes. The above evidence indicates that the biomass of the Queensland component of this stock is unlikely to be recruitment overfished.”;
- The New South Wales component of the Eastern Australian biological stock is assessed annually in terms of landings and catch rates (CPUE) in both the estuary and ocean fisheries. The annual spawning run fishery on ocean beaches is also assessed in terms of fish sizes and ages in landings. Commercial median catch rates have remained stable in the estuary fishery (kg per day of mesh netting) and increased slightly in the ocean fishery (kg per day of beach hauling) since the early 1980s. The size compositions of fish in ocean landings have remained stable, while the age compositions of fish in this fishery are generally between two and five years old, with some variations in year class strength. The above evidence indicates that the biomass of the New South Wales component of the stock is unlikely to be recruitment overfished.
On the basis of the above, it appears likely the stock is above the point of recruitment impairment (PRI). Nevertheless, given the age and uncertainty of the previous stock assessment there is limited evidence that the stock is currently fluctuating at or around a level consistent with MSY. Accordingly, the stock does not meet the low risk SG and we have scored this as medium risk.
PI SCORE – MEDIUM RISK
1B: Harvest Strategy
CRITERIA: (i) There is a robust and precautionary harvest strategy in place.
| (a) Harvest Strategy |
PRECAUTIONARY HIGH RISK |
The main measures serving to limit exploitation and monitor stock health in the ECIFFF include:
- limited entry in the commercial fishery, regulated through numbers of commercial fishing boat licenses and associated fishery symbols;
- gear restrictions (maximum allowable net lengths and number of nets and restricted net mesh size and net drop ranges);
- temporal restrictions (e.g. Barramundi spawning closure Nov-Feb; weekend closures);
- spatial restrictions under fisheries legislation (e.g. rivers and creeks closed to commercial fishers for resource allocation; Dugong Protection Area restrictions; Net Free Areas);
- spatial restrictions under State and Commonwealth marine parks legislation (e.g. Great Barrier Reef Marine Park – GBRMP, Great Barrier Reef Coast Marine Park – GBRCMP, Moreton Bay Marine Park – MBMP, Great Sandy Marine Park – GSMP);
- minimum legal sizes;
- overall catch limits applied to some species/species groups (e.g. Grey Mackerel, spotted mackerel, Tailor, sharks);
- requirement to report all retained species catches in catch and effort logbooks.
Recreational fishers harvesting ECIFFF species are subject to the same minimum legal size requirements, bag limits on some species and some fisheries and marine parks closures (e.g. green zones in the GBRMP, MBMP and GSSMP).
Fisheries Queensland collects biological data for a number of finfish species through the Fisheries Long Term Monitoring Program (LTMP) to complement the information obtained from commercial logbooks and recreational fishing diaries for various Queensland fisheries. The LTMP data include length, sex and age composition of the retained catch. Species monitored in the ECIFFF include Barramundi, Tailor, Sea Mullet, Spotted and Grey Mackerel, Yellowfin Bream, whiting (Sand, Golden-Lined and Trumpeter) and Dusky Flathead.
Periodic assessments of stock status for target species are undertaken either through the Status of Key Australian Fish Stocks (SAFS) reporting process, or through assessments of non-SAFS species examined at annual stock assessment workshops. Most assessments use a ‘weight of evidence’ approach based on available indices of abundance. Quantitative stock assessments have been performed for some species (e.g. Tailor, Grey Mackerel, sharks).
The ECIFFF has historically been subject to a performance measurement system (PMS), albeit assessment of performance against the PMS has been infrequent in recent years (most recently assessed for the 2013 fishing year). A PMS is not part of the regulatory framework; rather, it sets out how the sustainable use of fish stocks and acceptable fishery-related impacts on the broader ecosystem are to be achieved.
The east coast stock of Sea Mullet is primarily shared and harvested in NSW and Queensland. In NSW, the stock is harvested in both the Estuary General Fishery (EGF) and the Ocean Haul Fishery (OHF). Catches in the EGF and OHF range generally between 1000-2000t per annum per fishery (Stewart, 2015), while catches in the Queensland ECIFFF have a similar long-term average of around 2000 t per year. Recreational catch in both States is thought to be minimal in comparison to the commercial catch (e.g. Taylor et al, 2012; Webley et al, 2015). For this SI, the effectiveness of the harvest strategy is assessed across the stock as a whole.
In the ECIFFF, harvest controls include a restriction on license numbers, as well as a complex series of area closures, gear limitations and size and possession limits. Access to different areas and net configurations dictated by fishery ‘symbols’ attached to commercial fishing boat licenses (FBL). In broad terms, a FBL is required to operate a nominated primary boat and tender boats for commercial fishing, while the symbols which attach to the license dictate the types of fish able to be caught, the gear able to be used, areas able to be fished and the like. The fishery symbols that account for the bulk of the Sea Mullet catch are the ocean beach fishery (K symbol), tunnel net symbol (N10), N1 symbol and N11 symbol. The ECIFFF has been subject to substantial rationalization of symbol numbers in the past decade, although there are still comparatively large numbers available. As at February 2017, there were 36 K symbols, 22 N10 symbols, 86 N1 symbols and 281 N11 symbols[1], each of which is able to harvest mullet (albeit N11 symbols are primarily for harvesting bait). In 2015, 248 licenses reported harvesting mullet (Stewart et al, 2016a). Catches have been roughly equally split between the ocean beach (K) fishery and the non-ocean beach sectors in recent years.
In Queensland, the stock has been subject to routine length frequency and age-at-catch monitoring since 1999[2]. No well-defined harvest control rules exist, although the stock was previously the subject of a trigger point in the ECIFFF Performance Measurement System (PMS) requiring a review if combined catches across both Queensland and NSW exceeded a specified level (3620t).
In NSW, the harvest strategy for the EGF and the OHF primarily consists of 1) a limit on the number of fishers authorized to operate in the fisheries, 2) monitoring through logbooks, 3) temporal and spatial closures (approximately 70% of estuaries are open for fishing and many of these have additional closures within them, see http://www.dpi.nsw.gov.au/fisheries/info/closures/commercial/eg, also 50% of all beaches are closed to the OHF), 4) gear restrictions (i.e. mesh sizes and maximum net lengths) and 5) a minimum size limit of 30 cm. Recreational fishers are limited to both bag and size limits (20 Sea Mullet at 30 cm).
No well-defined harvest control rules exist, although the NSW Fishery Management Strategy (FMS) has a specific trigger point that requires the implementation of a recovery program if the exploitation status of a primary or key secondary species is changed to ‘overfished’ or ‘recruitment overfished’ by NSW DPI.
Considerable latency has been identified in the EGF and OHF (typical rates between 40-90% latency in permits, depending on zone; Stevens et al, 2012), which would likely limit the capacity of the management to adjust exploitation flexibly in response to changes in stock status. In order to address latency and other issues, the NSW Government is implementing a Commercial Fisheries Business Adjustment Program (the BAP) to link shares to either catch or fishing effort, provide assistance to fishing business to adjust their operations and streamline current fishing controls that impact fishing efficiency. In the EGF this includes the introduction of a total allowable effort cap and individual transferable effort days issued to each region, allocated on shares held[3].
There is uncertainty in the information on the likely effectiveness of the current harvest strategy. Based on virtual population analysis, Bell et al (2005) recommended a combined TAC of 3620 t for the NSW and Queensland fisheries (assuming a F0.1 harvesting strategy), although with a very high degree of uncertainty (95%C.I. 2232t:71153t). The trigger point in the ECIFFF PMS to review catch levels is based on this figure. Combined catches across both jurisdictions have exceeded the recommended TAC in every year since 2006, peaking in 2010 at over 5,800t (Stewart et al, 2016a). In response to the breaching of the PMS trigger, DAFF (2014a) concluded that “the Sea Mullet stock is shared with New South Wales where the bulk of the east coast Sea Mullet harvest is caught. Queensland catches are stable and within historical levels. Sea Mullet was recently assessed by New South Wales as ‘fully fished’ due to a long history of stable landings and catch rates for estuary and ocean fisheries in both jurisdictions. Sea Mullet is considered sustainably fished in Queensland. Given the harvest of Sea Mullet is already regularly monitored by both jurisdictions for unsustainable harvest signals, the triggering of this measure will not be investigated further.” Assessments against the PMS have reportedly been largely discontinued and will be superseded by other arrangements (e.g. formal harvest strategies) to be developed as part of a broader package of reforms for Queensland fisheries.
The harvest strategies for the stock overall is unlikely to be highly responsive to the state of the stock given the considerable effort latency and the absence of other overall controls on catch or effort. In the NSW fisheries, the respective Fishery Management Strategies for the EGF and OHF require action to be taken to limit exploitation only after a stock is classified as overfished. The best argument for the harvest strategy meeting the medium risk SG (i.e. that it will achieve the stock management objectives reflected in Performance Indicator 1A[i]) is that a number of indicators of abundance and recruitment (e.g. CPUE, length, age) are regularly monitored by both jurisdictions and to date have remained stable. Nevertheless, the substantial capacity for increases in effort on mullet given the combined latency in the NSW and Queensland fisheries means there is scope for catches to potentially exceed sustainable levels (particularly in the context of the recommended TAC of 3620 t, albeit highly uncertain) if effort is activated, such as in response to market forces. To that end, we have scored this SI precautionary high risk.
We note however that significant reform processes are currently underway in both jurisdictions which are likely to improve the position of the fishery against this SI in coming years.
[1] fishnet.fisheries.qld.gov.au
[2] https://www.daf.qld.gov.au/fisheries/monitoring-our-fisheries/commercial-fisheries/species-specific-programs/monitoring-reporting/sea-mullet-biological-monitoring-update
[3] http://www.dpi.nsw.gov.au/fishing/commercial/reform/decisions
| Shark-finning |
MEDIUM RISK |
|
In the ECIFFF, shark finning is regulated by making it mandatory for shark bodies to be held onboard with their fins and tail. Although more recent statistics were not available, DAFF (2014a) reported that no offences relating to illegal finning were detected between 2011 and 2013. At present, there is no observer coverage in the fishery so external validation of finning practices is limited. Stronger evidence of external validation would be required for a lower risk score.
CRITERIA: (ii) There are well defined and effective harvest control rules (HCRs) and tools in place.
| (a) HCR Design and application |
PRECAUTIONARY HIGH RISK |
|
In Queensland, the best approximation of a harvest control rule for Sea Mullet is the ECIFFF PMS, which requires a management response to be developed within three months of the management agency becoming aware that a trigger has been exceeded (DEEDI, 2009). The existing PMS trigger is based on the TAC of 3620t (for Queensland and NSW catches combined) recommended by Bell et al (2005), although assessments against the PMS have been largely discontinued (e.g. DEE, 2016). In NSW, the management strategy is assessed against the performance indicators (PI) in the FMS based on information from annual NSW DPI stock assessment workshops (e.g. NSW DPI, 2017). The main harvest PI in NSW for target species (develop a recovery plan if a species is assessed as overfished) is reactionary and does not serve to limit exploitation as PRI is approached. Notwithstanding that, a number of independent indicators of stock abundance (e.g. age/size structure of the commercial catch, CPUE) are actively monitored by both jurisdictions and have remained stable in recent years. Ongoing monitoring of these indicators is likely to be capable of detecting stock decline and could be used to justify reductions in exploitation if PRI was approached. Accordingly, we have scored this SI precautionary high risk.
We note that reform processes are underway in both jurisdictions which will likely improve the scoring of the stock against this SI. In Queensland, the Queensland Sustainable Fisheries Strategy 2017-2027 commits to the adoption of harvest strategies for all major fisheries by the end of 2020, with a priority to develop trawl, crab and inshore fisheries strategies by the end of 2018 (DAF, 2017a). Harvest strategies will include well-defined harvest control rules and aim to maintain stocks at levels above MSY. In NSW, the BAP will link shares to fishing effort, with the Structural Adjustment Review Committee (SARC) recommending the introduction of a total allowable effort cap and individual transferable effort days issued to each region of the EGF Mesh and Haul net sectors, and higher minimum shareholdings in the OHF General Purpose Hauling sector to reduce endorsement numbers. These initiatives should reduce latency and strengthen the effectiveness of tools available to adjust levels of exploitation where necessary.
PI SCORE – PRECAUTIONARY HIGH RISK
1C: Information and Assessment
CRITERIA: (i) Relevant information is collected to support the harvest strategy.
| (a) Range of information | MEDIUM RISK | |
There is good information on the distribution and biology, including stock structure, for Sea Mullet (e.g. Stewart et al. 2016). Work on the population structure of Sea Mullet indicates that they comprise a single stock on the east coast of Australia. Fleet composition of the EGF, OHF and Qld ECIFFF is well understood and catch and effort information is provided in the form of daily logbooks. However, changes in reporting arrangements mean there is some uncertainty around whether these constitute a robust time series in NSW (Stewart, 2015). Moreover, in Queensland only nominal cate appears to be monitored which may not be an accurate index of abundance. Periodic recreational fishing surveys are conducted that estimate Sea Mullet catch (e.g. Henry and Lyle 2004, Webley et al, 2015, West et al, 2016), and compared to the commercial catches the recreational harvest is quite low in both jurisdictions (<10t, Stewart, 2015, Webley et al, 2015, West et al, 2016). Age and length frequency information is regularly collected from the commercial catch in both jurisdictions and is examined for concerning stock trends as part of regular weight of evidence based assessments (e.g. Stewart, 2015; Stewart et al, 2016). However, the available information is not monitored in the context of a formal harvest control rule. While a range of information exists to support the harvest strategy, uncertainties in some components (e.g. in the NSW timeseries) mean it is not clear whether they are sufficient to support an effective HCR and harvest strategy. Accordingly, we have scored this SI medium risk.
| (b) Monitoring and comprehensiveness |
MEDIUM RISK |
Stock abundance is primarily monitored using catch and effort patterns in logbooks, supported by regular monitoring of age and size classes in the commercial catch[1]. The latter provides estimates of fishing mortality and magnitude and consistency of recruitment (Stewart et al, 2016). In Queensland, monitoring of effort and catch rate appears to be nominal only (rather than standardised) which may not be a reliable index of stock abundance (e.g. Harley et al, 2001). In NSW, catch and effort are collected by gear type, although changes in reporting arrangements over time mean that relative abundance may not be comparable throughout the time series. In particular, Stewart (2015) reports that “in 2009/10 fishing effort reporting requirements changed substantially and relative catch rates before and after this time may not be directly comparable. Relative catch rates may not be robust indicators of abundance and caution should be applied when interpreting these results”. Recreational catch is monitored periodically (the last survey in NSW was undertaken in 2013/4 – West et al, 2016 – and before that in 2000; surveys in Queensland are undertaken every 2-3 years – e.g. Webley et al, 2015). While there is good information on all removals from the stock, abundance is not monitored consistent with a harvest control rule and there is some uncertainty around the robustness of abundance indices from commercial logbook information. Nevertheless, other indicators (age/length frequency) are monitored regularly, and together with information on catch and effort, allows assessments of stock status according to generic stock status categories (e.g. Stewart et al, 2016).
[1] See for example, https://www.daf.qld.gov.au/fisheries/monitoring-our-fisheries/commercial-fisheries/species-specific-programs/monitoring-reporting/sea-mullet-biological-monitoring-update
CRITERIA: (ii) There is an adequate assessment of the stock status.
| (a) Stock assessment |
MEDIUM RISK |
|
A stock assessment has been completed for the Qld/NSW mullet stock (Bell et al, 2005), but has not been updated. The current assessment of Sea Mullet in both NSW and Queensland uses a ‘weight of evidence’ approach and estimates stock status according to generic categories (e.g. ‘sustainable’, ‘overfished’; Stewart et al, 2016; Stewart, 2015). A key information source is historical CPUE levels (approximates abundance), however there is some uncertainty in the interpretation of long-term trends in NSW due to changes in reporting methods during 2009/10. Despite this limitation, annual trends in the periods before and after 2009/10 demonstrate stability in CPUE. Size and age structure data from the commercial catch are also gathered to monitor stock response to harvest and recruitment in both jurisdictions (e.g. Stewart, 2015). In combination, these measures allow for assessment of status relative to generic reference points appropriate to the species category, consistent with medium risk.
| (b) Uncertainty and Peer review |
MEDIUM RISK |
|
The weight of evidence based approach currently used in each jurisdiction (e.g. Stewart, 2015; NSW DPI, 2017) and as part of the national stock status report (e.g. Stewart et al, 2016) attempts to account for uncertainty through the use of multiple indicators, but not in any quantitative way consistent with the low risk SG. The uncertainty of using CPUE data as an approximation of abundance is identified but not accounted for. Assessments undertaken as part of the national stock status report are reviewed externally.
PI SCORE – MEDIUM RISK
COMPONENT 2: Environmental impact of fishing
2A: Other Species
CRITERIA: (i) The UoA aims to maintain other species above the point where recruitment would be impaired (PRI) and does not hinder recovery of other species if they are below the PRI.
(a) Main other species stock status
The intent of this scoring issue is to examine the impact of the fishery on ‘main’ other species taken while harvesting the target species. ‘Main’ is defined as any species which comprises >5% of the total catch (retained species + discards) by weight in the UoA, or >2% if it is a ‘less resilient’ species. The aim is to maintain other species above the point where recruitment would be impaired and ensure that, for species below PRI, there are effective measures in place to ensure the UoA does not hinder recovery and rebuilding.
The ECIFFF is a complex fishery with multiple species targeted using a number of different net configurations across a wide geographic and habitat range. To that end, the catch composition of the fishery may vary markedly between inshore and offshore components, different netting types and different latitudes.
To inform the identification of main other species in each of the UoAs, data on retained catch composition in the ECIFFF was provided by DAF. For each of the three target species here – Grey Mackerel, Blacktip Shark and Sea Mullet – data were provided on the total retained catch composition when these species were recorded in the catch. Data excluded catches taken in the ocean beach (K) sector which was assessed separately. Grey Mackerel and Blacktip sharks are assessed under Component 1 in the full assessment report.
The main limitation in accurately calculating which other species meet the >5% and >2% thresholds in the ECIFFF is the absence of recent information on discards. The most comprehensive available study of bycatch in the ECIFFF was undertaken by Halliday et al (2001). This study examined a number of different sectors and concluded overall that net fishing had low rates of bycatch (7-28%) with a high proportion of the fish caught being marketed. Preliminary discard fate trials indicated that post-release mortality is likely to be species dependent, with low rates of discard mortality in some commercially important species (e.g. Yellowfin Bream – 0% after 3 days) and higher rates in more fragile species (~60-70% in Silver Biddies).
Overall they concluded that “gill nets are highly selective in their ability to capture targeted species. … Marketable catch from within these gill netting operations is high with low discard rates. The discarded component of the catch consists of a large number of species, many of which are discarded alive. These highly selective fisheries were not found to be affecting fish species that were not within the catching range of the nets allowed. Generally, the smaller the mesh size of the gill nets used in a fishery the greater the number of fish that were caught. As not all fish are marketed, particularly small ones, the bycatch component of the catch increased with decreasing mesh size.” They concluded that “six of the seven fisheries that were investigated would be ranked in the ten lowest “observed numbers-based discard ratios other than shrimp” as reported by the FAO (Alverson et al. 1994).”
There appears to have been limited detailed analysis of discarded bycatch in the ECIFFF since that time, other than targeted studies in the shark fishery (e.g. DEEDI, 2011). Although the PMS contains a trigger point monitoring the quantity of discards against the benchmarks in Halliday et al (2001), DAFF (2014a) reported that no systematic bycatch monitoring programs were implemented during the reporting period (2010-2013) that encompassed all species and methods in the ECIFFF, and therefore the trigger point was not assessed.
| Mesh Net | MEDIUM RISK | |
Sea Mullet are targeted in inshore components of the ECIFFF and across a broad geographic range although the majority of the catch is taken in southern Queensland. Table 4 sets out the retained catch composition in the ECIFFF for all logbook records in which Sea Mullet catches were reported in the non-ocean beach (K) sectors. Records show all species which accounted for >2% of the total catch in any one year between 2014 and 2016.
The identification of individual main other species is complicated by the reporting of catches in undifferentiated groupings which may contain multiple species (e.g. ‘whiting – unspecified’). Nevertheless, a reasonable assumption can be made that the majority of ‘whiting’ are likely to be Sand Whiting (Sillago ciliata), the majority of ‘Bream’ are likely to be Yellowfin Bream (Acanthropagrus australis) and the majority of ‘Flathead’ are likely to be Dusky Flathead (Platycephalus fuscus). Based on the retained catches reported, only ‘whiting’ and ‘bream’ meet the >5% threshold to be considered a main retained species. Flathead and Barramundi may account for >2% on average across the three years, although neither would be considered a less resilient species. On the assumption that Sand Whiting and Yellowfin Bream are the main species in their respective groupings, we have assessed these two species as main other species.
Table 4: Retained catch composition (percentage of total retained catch) from the ECIFFF from all logbook records where Sea Mullet was reported in the catch (Data source: DAF).
| Species | 2014 | 2015 | 2016 |
| Mullet – unspecified | 63.33 | 63.76 | 60.08 |
| Whiting – unspecified | 6.26 | 5.98 | 5.81 |
| Bream – unspecified | 5.66 | 7.42 | 7.02 |
| Barramundi | 2.85 | 1.80 | 1.72 |
| Bait fish | 2.32 | 1.79 | 2.43 |
| Flathead – unspecified | 2.25 | 2.17 | 2.78 |
| Threadfin – blue | 2.01 | 1.38 | 1.37 |
Sand whiting
Sand Whiting occur along the east coast of Australia, and are most abundant in southern Queensland and northern New South Wales. Tagging studies have shown movement of adult fish between estuaries, but information on biological stock boundaries remains incomplete. Because the biological stock composition is unknown, no formal assessment at the stock level has been possible. Separate assessments of Sand Whiting have been conducted in Queensland and New South Wales and stock status of Sand Whiting is reported at the jurisdictional level. This assessment follows that convention and assesses the Queensland ‘stock’ separately.
McGilvray and Hall (2016) list this stock as ‘sustainable’ and states: “the nominal catch rate in 2015 (68 kg per day) was the highest ever recorded for the 2000–15 period. Fishery-dependent monitoring of Sand Whiting, beginning in 2007, indicates consistent length and age structures. These are good indicators of a stable population with continued recruitment. The above evidence indicates that the biomass of this stock is unlikely to be recruitment overfished”. Based on this, the stock is probably highly likely to be above PRI.
Yellowfin Bream
A genetic investigation has shown that Yellowfin Bream forms a single east coast population, with a general northward dispersal of adults and a southward dispersal of larvae (Roberts and Ayre, 2010). McGilvray et al (2016) report that “in the Queensland part of the Eastern Australian stock, the commercial catch and nominal catch rate of Yellowfin Bream are improving after a change to the minimum legal size (MLS), from 230–250 mm, and the increase in areas protected from fishing in the Moreton Bay Marine Park in 2009 (107 tonnes [t] at 28 kg per day in 2010; 172 t at 48 kg per day in 2015 in the net fishery). Length structures from fishery-dependent monitoring of Yellowfin Bream from 2007 onwards also reflect this rebuilding catch trend. The fishery-dependent age structures indicate a stable population with variable and continued recruitment. The above evidence indicates that the biomass of the Queensland part of the stock is unlikely to be recruitment overfished.” On this basis, the stock appears highly likely to be above the PRI.
Similar to other ECIFFF UoAs, the main data limitation is on the volume and composition of discards which have not been monitored in recent years. Nevertheless, available information indicates that Sea Mullet netting in the ECIFFF is highly targeted with few discards. For example, in a small observer study (79 net shots), discards represented 5.6% of the total catch, with discards dominated by undersized or regulated commercial species (e.g. undersized Yellowfin Bream, undersized Mud Crabs, female Mud Crabs) (Halliday et al, 2001). In addition, a considerable range of measures are in place (e.g. spatial closures, temporal closures, minimum mesh sizes, maximum net lengths) which could be expected to ensure the UoA does not hinder recovery and rebuilding if necessary.
Accordingly, while the status of main other species in relation to PRI is not known with certainty, the two species comprising >5% of the retained catch are highly likely to be above the PRI and for other species there are a range of measures in place which could be expected to ensure the UoA does not hinder recovery and rebuilding if necessary. On this basis, we have scored this SI medium risk.
Each of the ECIFFF UoAs would be better positioned against this SI with ongoing independent monitoring of cach composition.
| Ocean Beach (K) fishery | LOW RISK | |
Retained species
Recent data on the catch composition of the ocean beach net (‘K’ symbol) sector specifically does not appear to be publicly available, although historical information and more recent catch trends in the broader ECIFFF can be used to determine likely ‘main other’ species. Williams (2005) noted that Sea Mullet historically accounted for over 90% of the QOBNF catches, with Tailor (Pomatomus saltator) (7% of the retained catch) the only other retained species likely to meet the ‘main’ other threshold during the period the examined (1990-2003). During this period Tailor catches averaged 61t (between 1990-2) and 51t (2001-3). Catches of Tailor in the ECIFFF averaged around 53t in the most recent five years reported (2011-12 to 2015-16). At the same time, Sea Mullet catches in the QOBNF appear to have remained relatively stable[1]. Bream and dart have historically accounted for around 1% respectively of the QOBNF catch (Williams, 2005). Accordingly, although precise recent catch composition in the QOBNF specifically is not reported, we have assessed Tailor here as a main other species.
Tailor
Litherland et al (2016) report that genetic evidence indicates that there are two biological stocks of Tailor in Australia, one along the east coast and a second along the west coast. The Eastern Australian biological stock is distributed from Bundaberg in southern Queensland along the entire New South Wales coast and into eastern Bass Strait in Victoria.
Leigh et al (2017) recently examined the status of the east coast Tailor stock using an age-structured population dynamic model. They estimated that the exploitable biomass of Tailor was around 50% of virgin level from the mid- 1980s to 2012 and is likely to have increased since that time. Maximum sustainable yield (MSY) in an average year was estimated to be around 1350 tonnes per year but could be as low as 1000 tonnes per year. Combined commercial and recreational catch since 2010 have been around 300t. Accordingly, it is highly likely the stock is above PRI.
Discarded species
Specific information on the composition of discards from the QOBNF appears to be limited, although Stewart et al (2016) report that beach seining for Sea Mullet is highly targeted and as a result there is very little bycatch. Given the nature of the fishery, in which largely mono-specific schools of Sea Mullet are visually identified before being ‘set’ on, rates of discards are likely to be lower than the inshore fisheries for mullet in which discards are themselves quite limited (e.g. 5.6% of the total catch; Halliday et al, 2001). Accordingly, it is unlikely that any discarded species would meet the threshold as a main other species.
[1] https://www.daf.qld.gov.au/fisheries/monitoring-our-fisheries/commercial-fisheries/species-specific-programs/monitoring-reporting/sea-mullet-biological-monitoring-update
CRITERIA: (ii) There is a strategy in place that is designed to maintain or to not hinder rebuilding of other species.
(a) Management strategy in place
Generic measures in place to monitor and manage other species in the ECIFFF are largely the same those for the target species and include:
- Limited entry through fishing boat licenses and relevant symbols;
- Gear restrictions, including net length, number and mesh size restrictions;
- Extensive spatial closures, though both fisheries and marine parks legislation (GBRMP, GBRCMP, GSMP, MBMP);
- Temporal restrictions, including a three-month Barramundi spawning closure and weekend closures;
- TACCs on some species (e.g. spotted mackerel, Tailor, sharks)
- Compulsory reporting of retained species in catch and effort logbooks;
- Minimum legal sizes (MLS) for many species, largely set a level that will allow spawning at least once.
Periodic stock assessments are undertaken of selected species, usually using a weight of evidence based approach[1]. No ongoing independent monitoring of catch occurs. Although species specific risk assessments have been undertaken, no comprehensive ecological risk assessment has been undertaken for the ECIFFF.
[1] https://www.daf.qld.gov.au/business-priorities/fisheries/monitoring-our-fisheries/data-reports/sustain ability-reporting/stock-status-assessments
| Mesh net |
MEDIUM RISK |
|
The main other retained species taken while harvesting Sea Mullet are Sand Whiting and Yellowfin Bream. In addition to the generic measures set out above, the main species specific measures in place include:
Sand Whiting
- A MLS of 23cm, which allows a proportion of mature fish to spawn at least once;
- Monitoring through the LTMP to complement the information obtained from commercial logbooks and recreational fishing diaries for various Queensland fisheries. Data collected include length, sex and age composition of the retained catch;
- Regular ‘weight of evidence’ based assessments of stock status.
Estimates of mortality for Sand Whiting in Queensland (from catch curves) are high (the rate of fishing mortality [F] is close to the rate of natural mortality [M]), indicating a fully-fished stock; however, the estimates have remained steady at these levels since 2007 (McGilvray and Hall, 2016). Together with the generic measures above, these measures are likely to be considered at least a partial strategy to maintain Sand Whiting at levels highly likely to be above the PRI.
Yellowfin Bream
- A MLS of 25cm, which allows a proportion of mature fish to spawn for one, or even several years before becoming available to the fishery (McGilvray et al, 2016)
- Monitoring through the LTMP to complement the information obtained from commercial logbooks and recreational fishing diaries for various Queensland fisheries. Data collected include length, sex and age composition of the retained catch;
- Regular ‘weight of evidence’ based assessments of stock status.
Estimates indicate that fishing mortality has been lower than natural mortally for the years 2007–15 (McGilvray et al, 2016). These measures are likely to be considered at least a partial strategy to maintain Yellowfin Bream at levels highly likely to be above the PRI.
As with other ECIFFF UoAs, the main uncertainty in the management of other species is volume and composition of discarded catches not recorded in logbooks given the absence of independent catch monitoring. Although the composition of these species is not well-known, there are a substantial range of measures in place (e.g. spatial closures, temporal closures, minimum mesh sizes, maximum net lengths) which could be expected to ensure the UoA does not hinder recovery and rebuilding if necessary. Accordingly, we have scored this SI medium risk.
| Ocean beach (K) fishery |
LOW RISK |
|
In addition to the generic arrangements above, a competitive TACC of 120t applies to Tailor. The species has recently had a quantitative asessment undertaken (Leigh et al, 2017) and was previousy the subject of regular ‘weight of evidence’ based assessments. The main weaknesses in the management system appears to be a mechanism to independently validate commercial fisher logbooks, the absence of a well-defined HCR underpinning the TACC for Tailor, and monitor the composition of non-target species catch. Nevertheless, given the highly targeted nature of the fishery and the fact that the TACC (120t) for Tailor is a small fraction of the estimated MSY (1,000t+), these measures appear sufficient to ensure there is a high likelihood that main other species will remain above PRI. The Queensland Government has committed to strengthening the validation of fisher logbooks as part of the Queensland Sustainable Fisheries Strategy 2017-2027 (DAF, 2017a).
(b) Management strategy evaluation
| Mesh net |
MEDIUM RISK |
|
For Sand Whiting and Yellowfin Bream, regular weight of evidence based assessments together with monitoring of length and age frequencies and estimates of F provide an objective basis for confidence that the measures in place will work. For other species including discards, there is a plausible argument that the measures in place will work, but the absence of ongoing monitoring means there is no objective basis for confidence.
| Haul net |
LOW RISK |
|
The recent stock assessment for Tailor (Leigh et al, 2017) provides an objective basis for confidence that the strategy will work.
| (c) Shark-finning | MEDIUM RISK | |
In the ECIFFF, shark finning is regulated by making it mandatory for shark bodies to be held on board with their fins and tail. Although more recent statistics were not available, DAFF (2014a) reported that no offences relating to illegal finning were detected between 2011 and 2013. At present, there is no observer coverage in the fishery so external validation of finning practices is limited. Stronger evidence of external validation would be required for a lower risk score.
CRITERIA: (iii) Information on the nature and amount of other species taken is adequate to determine the risk posed by the UoA and the effectiveness of the strategy to manage other species.
(a) Information
| Mesh net |
MEDIUM RISK |
|
The main sources of information for Sand Whiting and Yellowfin Bream come from commercial fisher logbooks, periodic recreational fishing surveys (e.g. Taylor et al, 2012; Webley et al, 2015) and data collected through the LTMP. Under this program, Fisheries Queensland collects biological data for a number of finfish species to complement the information obtained from commercial logbooks and recreational fishing diaries for various Queensland fisheries. These data include length, sex and age composition of the retained catch. These data are quantitative and provide sufficient information to undertake ‘weight of evidence’ based assessments of the stock, including the likely impact of the ECIFFF.
Historical information on bycatch species composition from the south east Queensland Sea Mullet fishery is available from Halliday et al (2001). However, the information is now close to two decades old and considerable management changes have been introduced into the fishery since that time. This information is probably sufficient to qualitatively determine that bycatch is likely to be limited, and therefore likely to have limited impact on other species, but there is little recent quantitative information. Accordingly, we have scored this SI medium risk.
| Ocean beach (K) fishery |
MEDIUM RISK |
|
Quantitative information on catch composition in the ocean beach net sector is available for retained species, but limited for discarded species (which are likely to be very low). Of the retained species likely to qualify as main other, sufficient quantitative information is available to support population dynamic modelling for Tailor (Leigh et al, 2017) and assess the impact of the UoA with respect to status. For discarded species, sufficient qualitative information is available to indicate that the impacts of the fishery is likely to be very minimal (given the fishery largely targets mono-specific schools by sight fishing from beaches). The fishery would be better placed against this SI with some quantitative information on total catch composition.
PI SCORE – LOW RISK – Sea Mullet – Ocean Beach (K) fishery
PI SCORE – MEDIUM RISK – Sea Mullet – Mesh net
2B: Endangered Threatened and/or Protected (ETP) Species
CRITERIA: (i) The UoA meets national and international requirements for protection of ETP species.
The UoA does not hinder recovery of ETP species.
(a) Effects of the UoA on populations/stocks
|
ECIFFF – general |
PRECAUTIONARY HIGH RISK |
A large number of ETP species are known to occur within the area of the ECIFFF including dugongs, sea turtles, sawfish, inshore dolphins, humpback whales, sea snakes, pipefish, and protected shark species (e.g. Speartooth Shark, Hammerheads) amongst others.
The information available on ETP interactions largely comes from reporting through compulsory SOCI logbooks, public reports of sick and injured ETP species compiled in StrandNet (a database of ETP – mainly dugong, turtle and cetacean – reports managed by the Queensland Department of Environment and Heritage and the GBRMPA), and periodic population surveys (e.g. Sobtzick et al, 2017; Meager et al, 2013, for a review of Dugong population surveys and trends in southern Queensland). Fisheries Queensland operated a voluntary observer program in the late 2000s and early 2010s, but the program was discontinued in 2012.
In the absence of independent observer information, data on interactions between the ECIFFF and ETP species is limited and can be conflicting. For example, SOCI logbook reports indicate only one dugong interaction in the fishery in 2012, with the animal being released alive. However, StrandNet data attributes at least two mortalities in 2012 to net fishing (Meager et al, 2013), with a number of other unconfirmed reports of net fishing interactions received. Likewise, no sawfish or protected sharks were reported in the fishery in the years 2011 to 2013, although evidence from previous observer studies (e.g. Salini et al, 2007; DEEDI, 2011, which included effort in the ECIFFF directed at Grey Mackerel) suggests this is unlikely.
Table 5: SOCI logbook reports of ETP species interactions in the ECIFFF (DAFF, 2014a).

Sea Turtles (Low risk)
Anecdotal evidence suggests that the majority of net fishing interactions with turtles are relatively brief in nature, with most turtles ‘bouncing off’ the net and swimming away unharmed. This is consistent with SOCI logbook information from 2011-2013 indicating that all but two of the 115 interactions resulted in the turtle being released alive (DAFF, 2014a). Notwithstanding that, net fishing has been implicated as a potential source of turtle mortality after extreme flooding events, where animals are in poor condition and are generally more vulnerable to capture and less able to survive interactions (Meager et al, 2013).
Notwithstanding the possibility of occasional higher rates of mortality following floods, the generally low level of interaction across the fishery suggests that the known direct effects of the UoA are highly unlikely to be hindering recovery of the green turtles. Census data from the southern GBR population of green turtles demonstrate that the nesting population has been increasing steadily across more than four decades at an average of about 3% per year (Limpus et al, 2013). In some of the northern GBR nesting areas declines in nesting success have been observed, though this has been attributed to rising water tables[1].
Dugongs (Medium risk)
Dugong are a listed marine species under the EPBC Act and listed as vulnerable on the IUCN Red List. The northern Great Barrier Reef region (from Hunter Point in the north to Cape Bedford near Cooktown further south) has the largest area of seagrass in the Great Barrier Reef and supports one of the largest populations of dugongs on the eastern Queensland coast (Marsh et al 2002). In the Great Barrier Reef Marine Park, the dugong population size is estimated at 14,000 animals (Dobbs et al 2008). In the Queensland urban coast, including the southern part of the Great Barrier Reef and areas further south of the reef, population size has been difficult to estimate due to large scale movements of dugongs in the area (Marsh et al 2002).
Marsh et al (2001) used records from the government shark control program to hindcast changes in dugong numbers over the last four decades along a 10° latitude stretch of the urban coast of Queensland, south of Cairns. The catch per unit effort of dugongs as by-catch suggests that populations have declined to about 3% of their size in the early 1960s in this region. However, following assessment of the carrying capacity of dugong habitats, Marsh et al. (2005) concluded that contemporary dugong habitat between 16.5°S and 28°S was unlikely to have been able to support the number of dugongs in their hindcast estimate, which suggested that they either overestimated the number of dugongs in 1962 or that the carrying capacity of the region has reduced since. Records since the 1980s suggest the dugong population along the urban coast of Queensland has been stable (Meager et al, 2013).
Recently, the population status of the dugong in the coastal waters of Queensland from just north of Hinchinbrook Island to the Queensland-New South Wales border was estimated using aerial survey (Sobtzick et al, 2017). The study found that the surveyed portions of both the southern and central stock and the north Queensland and Torres Strait stock of dugong has increased since the 2011 surveys (Figure 4). The increase was most notable in the southern GBR. These authors attributed much of the increase to improvements in the condition of intertidal seagrass percentage cover, which were impacted by extreme weather events of 2010/11.
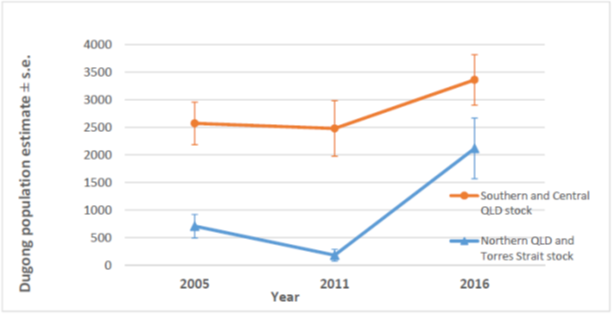
Figure 4: Dugong population size estimate in 2005, 2011, and 2016 for the Southern and Central QLD and Northern QLD and Torres Strait Dugong stocks (from Sobtzick et al, 2017)
While gillnet fishing in the ECIFFF has historically been identified as an important source of human induced dugong mortality, the extent to which the fishery interacts with dugong populations under current arrangements is unclear. Considerable management change has occurred in the fishery to reduce its impact on dugongs since the mid-1990s including:
- the introduction of a network of Dugong Protection Areas in key dugong habitats throughout the Queensland coast, which either prohibit large mesh netting or restrict its operation;
- Substantial spatial closures have been enacted under the GBRMP Zoning Plan 2003;
- Attendance at net requirements;
- Tactical spatial arrangements in ‘hot spots’ (e.g. Bowling Green Bay, South East Facing Island)
- Reduction in large mesh netting symbols through various buyouts.
Many net fishers also take considerable care to avoid dugong interactions through best practice behaviours and novel gear designs (e.g. Welch et al, 2016).
Information provided in SOCI logbooks suggests that interaction rates are very low, however other sources suggest rates may be higher (e.g. Meager et al, 2013). Nevertheless, the outcomes of the most recent aerial surveys suggest both the southern and northern populations of dugong are capable of increasing in number in response to favourable environmental conditions and in the presence of a relatively stable levels of netting effort. Accordingly, the available evidence suggests that the known direct effects of the ECIFFF are likely to not hinder recovery of dugong populations. On that basis, we have scored this medium risk. Given the absence of independent monitoring of interactions however, it is not possible to conclude this with any greater certainty. The fishery would be substantially better positioned against this SI with a mechanism to independently validate fisher SOCI logbook reporting.
Inshore dolphins (Precautionary high risk)
There are a number of inshore dolphin species in the area fished by the ECIFFF, although those most likely to be at risk are Indo-Pacific Humpback (Sousa chinensis) and Australian Snubfin Dolphins (Orcaella heinsohni). Currently, there are no overall population estimates for either species and their status cannot be assessed due to the lack of data. Nevertheless, GBRMPA (2012a) suggest that populations are likely to be in decline, and identify incidental capture in commercial gillnetting as an important risk.
Three cetaceans were reported to have been captured in ECIFFF between 2011-2013 according to SOCI logbooks, although the species is not reported (DAFF, 2014a). There is currently no independent observer coverage in the ECIFFF to provide data validation of the SOCI logbooks. To this end, we have scored this SI precautionary high risk.
Sawfish (High risk)
Four species of Sawfish occur within the area fished by the ECIFFF: Freshwater Sawfish (Pristis microdon), Dwarf Sawfish (Pristis clavata), Green Sawfish (Pristis zijsron), Narrow Sawfish (Anoxypristis cuspidata) (GBRMPA, 2012b). All four species are listed under the IUCN Red List as endangered or critically endangered globally[2], and the three Pristis species (Green, Dwarf and Freshwater Sawfish) are listed as vulnerable marine species under the EPBC Act 1999. Sawfish are susceptible to capture in gillnets given their distribution overlaps with target species in the ECIFFF, and because their toothed rostrum becomes easily enmeshed (Stevens et al, 2008). Gillnetting is listed as one of the main threats to each of the Sawfish species (TSSC, 2014).
While the total population of the freshwater Sawfish is unknown, Phillips et al (2008) suggested that the species, though highly mobile when adult, should be considered in Australian waters as ‘independent demographic units’ (populations) rather than a single population.
Stevens et al (2008) report that “available data shows a rapid decline in Sawfish numbers and a severe range retraction along the east coast. Entanglement in commercial fishing nets is the main threat to Sawfish populations.” Moreover, Stevens et al (2005) note that Sawfish are now virtually extinct in NSW and South East Queensland.
Pristid by-catch from the Queensland Shark Control Program comprises a large dataset over about 30 years of beach meshing around major Queensland population centres during the summer months. Although species identifications or biological data are lacking, these data reportedly show a clear decline in Sawfish catch from 1970-1990, over which period the fishing effort was relatively constant (Giles et al., CSIRO Marine Research, unpublished report cited in Stevens et al. 2005).
In a conservation assessment of Sawfish, Stevens et al (2005) stated that additional closures to gillnetting of suitable inshore coastal habitat will be required in order to prevent these species from disappearing from the east coast. In response, three rivers flowing into Princess Charlotte Bay identified as Sawfish habitat (Kennedy, Bizant and Normanby Rivers) were closed to commercial netting by the then Queensland Department of Employment, Economic Development and Innovation.
Salini et al (2007) reported that Anoxypristis cuspidata has a high susceptibility in this fishery and should be closely monitored due to the fact that population of all species of Sawfish have declined along the east coast of Australia in the past 20 years.
There are limited reliable data on catches of Sawfish in the ECIFFF. SOCI logbook data in DAFF (2014a) suggest that no Sawfish were taken in the fishery in 2005-6 or during the period 2010-2013, although these data appear inconsistent with previous reports indicating gillnets resulted in the highest rates of interaction of any fishing gear (Stevens et al, 2005), and isolated observer studies demonstrating capture of these species. For example, in 233 observer sea days in the ECIFFF between 2009 and 2011, over 30 Sawfish (mostly Narrow Sawfish) were incidentally captured, with a post-release mortality of around 50% (DEEDI, 2011). Harry et al (2011) also document the catch of 75 Narrow Sawfish and seven Green Sawfish during an observer survey in the ECIFFF between 2006 and 2009. Since 2012 there have been no independent observer data to verify interactions, and coverage rates prior to this were very low. The extent to which this level of interaction will contribute to the species decline is unknown.
Given evidence of capture in the fishery through observer studies, the absence of reliable independent information on interactions and strong evidence of population decline and range contraction, we have scored sawfish high risk.
Protected sharks (High risk)
A number of sharks recognised under the EPBC Act are known to exist within the area of the ECIFFF and have some degree of interaction with the fishery. These include Speartooth Shark Glyphis glyphis (Critically Endangered), Shortfin Mako Isurus oxyrinchus (listed migratory species) and a number of species added to CITES Appendix II in September 2014 [Sphyrna lewini (Scalloped Hammerhead Shark), S. mokarran (Great Hammerhead Shark), S. zygaena (Smooth Hammerhead Shark), Lamna nasus (Porbeagle Shark) and Carcharhinus longimanus (Oceanic Whitetip Shark)].
For hammerhead sharks, in 2014, Australia’s CITES Scientific Authority determined that Australia’s national take of hammerhead sharks would not be detrimental to the survival of the species if catch was restricted to historical levels (DoE, 2014). Catch levels accepted as non detrimental to S. lewini, S. mokarran and S. zygaena were 200t per year, 100t per year and 70t per year respectively for Australian fisheries (DoE, 2014). Based on catches reported between 2012 and 2015 (ranging between 52t and 98t in total across all species), DEE (2016) considered catch in the ECIFFF to be sustainable. The ECIFFF was approved as a Wildlife Trade Operation for the purposes of taking CITES Appendix II listed species in September, 2016.
- glyphis was previously reported from rivers in the Princess Charlotte Bay area of Eastern Cape York (Field et al., 2008, Pillans et al., 2009; in TSSC, 2014). However, it is likely that Speartooth Sharks are extirpated from several Queensland river systems in which they were previously found, with no confirmed records from Queensland’s east coast since 1983. Remaining populations are often isolated, raising concerns about their viability (TSSC, 2014). TSSC (2014) list the main identified threats to Speartooth Sharks as commercial fishing activities, recreational fishing, Indigenous fishing, illegal, unreported and unregulated fishing (IUU), and habitat degradation and modification.
There appear to be no reliable data on the levels of catch of Glyphis in the ECIFFF, and no current independent observer program. In the adjacent Gulf of Carpentaria, there is evidence to suggest that interactions are often underreported, with observer data from one fishery indicating that interactions with Speartooth Sharks may be significantly higher than the figures recorded in logbooks would suggest (DEEDI, 2010; in TSSC, 2014).
The primary habitat of Speartooth Sharks on the east coast of Queensland appears to be north of Princess Charlotte Bay (DoE, 2015). This is outside the main fishing grounds for Sea Mullet and Grey Mackerel, although Blacktip Sharks may be taken. The extent to which there may be overlap between Blacktip Shark effort and Glyphis habitat is unknown.
Given the critically endangered status of Glyphis, the absence of reliable information on interactions and observer evidence from similar fisheries in the adjacent Gulf of Carpentaria that catches may be higher than those reported in logbooks, we have scored Speartooth Sharks high risk.
The TSSC recommended priority be placed on reviewing and improving the ability of commercial fishery monitoring programs to provide accurate (validated) data on the extent of fishery interactions with Speartooth Sharks (TSSC, 2014).
Given the inshore nature of the ECIFFF, there are likely to be very limited interactions with Porbeagle, Oceanic Whitetip and Shortfin Mako Sharks.
[1] http://www.environment.gov.au/cgi-bin/sprat/public/publicspecies.pl?taxon_id=1765
[2] http://www.iucnredlist.org/
|
Ocean beach (K) fishery |
MEDIUM RISK |
Because of the nature of the targeted Sea Mullet beach hauling operation in the ocean beach net sector, ETP interactions are likely to be very rare. Moreover, any ETP species taken in the haul could probably be released alive. The EIS for the adjacent NSW Ocean Haul Fishery (OHF) notes the possibility of interaction with 43 protected species, although concludes overall that “whilst hardly definitive or based on an abundance of scientific data, the factors listed above suggest that the Ocean Hauling Fishery in its current form is not having a direct and/or adverse impact on any threatened species, populations, ecological communities or their habitats. There is, however, a high degree of uncertainty associated with this assessment due to the paucity of quantitative data and reliance upon anecdotal or speculative information” (NSW Fisheries, 2002).
Accordingly, we have scored the fishery medium risk against this SI. Nevertheless, we note the information base is weak and the fishery would be considerably better placed against this SI with some form of independent verification of low rates of interaction.
CRITERIA: (ii) The UoA has in place precautionary management strategies designed to:
- meet national and international requirements; and
- ensure the UoA does not hinder recovery of ETP species.
(a) Management strategy in place
| ECIFFF – general |
PRECAUTIONARY HIGH RISK |
|
A considerable number of management changes have been implemented since the mid-1990s to limit the impact of the ECIFFF on ETP species. These include:
- the introduction of a network of Dugong Protection Areas in key Dugong habitats throughout the Queensland coast, which either prohibit large mesh netting or restrict its operation;
- Substantial spatial closures under the GBRMP Zoning Plan 2003, the GBR Coast Marine Park, the Great Sandy Marine Park and Moreton Bay Marine Park;
- Substantial spatial closures under fisheries legislation;
- Attendance at net requirements, designed to improve the ability of fishers to detect interactions and release animals unharmed;
- Tactical spatial arrangements in ‘hot spots’ (e.g. Bowling Green Bay, South East Facing Island)
- Reduction in large mesh netting symbols through various buyouts;
- Introduction of catch limits on hammerhead sharks in 2018;
- Introduction of a compulsory SOCI logbook;
- A limited period of observer coverage, albeit this was discontinued in 2012.
Grech et al. (2008) compared net fishing data between January to June 2004 and January to June 2005 to assess the risk of bycatch of dugongs under the new zoning management arrangements. They found that in January to June 2005 there was ‘nil’ risk of bycatch for all dugong management units of high conservation value identified by Grech and Marsh (2007) along the urban coast (Cairns and south) and in 36% of the corresponding units in the remote Cape York. A ‘nil’ risk of bycatch was present in half of the management units of medium conservation value. Along the urban coast, all the dugong management units of high conservation value and 90% of the units of medium conservation value where current zoning provides a low risk of bycatch to dugongs are within Zone A DPAs (Grech et al. 2008). These measures will also likely provide protection to other species inhabiting similar areas such as inshore dolphins, sawfish and protected sharks.
While actual rates of interaction remain uncertain in the absence of ongoing observer coverage, effective implementation of the above measures could be expected to result in the fishery not hindering the recovery of turtles and dugongs. This is consistent with recent aerial survey results showing dugong population was able to increase between the 2011 and 2016 surveys with improvements inshore seagrass coverage (Sobtzick et al, 2017). The limited amount of observer coverage suggests that the majority of turtle interactions result in the animal being released alive (DEEDI, 2011).
Nevertheless, the extent to which sawfish, inshore dolphins and some protected sharks are protected by the current arrangements is unclear.
| Ocean beach (K) fishery |
MEDIUM RISK |
Given the probable very low rates of interaction with ETP species, there are few specific measures to limit interactions. Nevertheless, many of the generic measures in place would serve to minimise any impacts. These include:
- Substantial spatial closures under the Fisheries Act, the Great Sandy Marine Park and Moreton Bay Marine Park;
- Limitations on gear length and type;
- Limits on fishing season;
- Monitoring of interactions through a compulsory SOCI logbook.
These measures could be expected to ensure the fishery is not likely to hinder recovery of ETP species.
(b) Management strategy implementation
| ECIFFF – general |
PRECAUTIONARY HIGH RISK |
The measures in place could be considered likely to work for sea turtles and dugong which are relatively well studied. The extent to which they work for sawfish, inshore dolphins and some protected sharks, which are comparatively less well studied, is uncertain.
| Ocean beach (K) fishery |
MEDIUM RISK |
Given the likely very low rates of interaction and the capacity to release captured ETP species alive, the measures in place could be considered likely to work based on plausible argument. Nevertheless, the fishery would be considerably better positioned with independent verification of low rates of interaction.
CRITERIA: (iii) Relevant information is collected to support the management of UoA impacts on ETP species, including:
- information for the development of the management strategy;
- information to assess the effectiveness of the management strategy; and
- information to determine the outcome status of ETP species.
(a) Information
| ECIFFF – general |
PRECAUTIONARY HIGH RISK |
|
Some quantitative information is available on interactions through SOCI logbooks, as well as through limited observer coverage (e.g. DEEDI, 2011) and periodic surveys of populations and impact on some of the relatively well-studied species (e.g. Meager et al, 2013; Sobtzick et al, 2017). Nevertheless, the information in SOCI logbooks appears to be contradicted by other data sources in some cases and there is evidence from similar fisheries indicating that SOCI interactions are under-reported. Information on interactions with some species such as sawfish and inshore dolphins is lacking. There is currently no independent mechanism to validate SOCI logbook reporting.
| Ocean beach (K) fishery |
MEDIUM RISK |
Some quantitative information is available on interactions through SOCI logbooks, as well as through periodic surveys of populations and impact on some of the relatively well-studied species. Nevertheless, no structured independent verification of SOCI logbook data exists and there is currently no ongoing observer program to provide independent information on rates of interaction. Qualitative information is available through researcher interaction with the QOBNF which is likely to anecdotally confirm very low rates of ETP species interaction.
PI SCORE – MEDIUM RISK – Sea Mullet – Ocean Beach (K) fishery
PI SCORE – HIGH RISK –, Sea Mullet – Mesh net
2C: Habitats
CRITERIA: (i) The UoA does not cause serious or irreversible harm to habitat structure and function, considered on the basis of the area(s) covered by the governance body(s) responsible for fisheries management
(a) Habitat status
| ECIFFF – general | LOW RISK | |
The ECIFFF net fishery targeting the species assessed here typically operates in inshore waters, from rivers and creeks to nearshore areas targeting Grey Mackerel and Blacktip Sharks. Halliday et al (2001) reported that damage to physical environments is minimal as nets are either fished actively, being hauled across the substratum by hand, or set via anchors to passively fish a fixed position on the sea floor. Nets are typically set on sandy/muddy substrates away from hard physical structures to avoid entanglement.
In addition, net fishing is subject to extensive closed areas under fisheries and marine parks legislation (GBRMP, GBRCMP, GSSMP, MBMP) that is likely to provide protection for representative habitat types throughout the area of the fishery.
Given the above, the UoA is highly unlikely to reduce structure and function of habitats.
|
Sea Mullet – Ocean beach (K) fishery |
LOW RISK |
The ocean beach net fishery operates in highly dynamic, surf zone environments with schools of Sea Mullet targeted over unconsolidated sand habitats. Although not specific to beach seines, Halliday et al (2001) noted that damage to physical environments from the ECIFFF is minimal as nets are fished actively, being hauled across the substratum by hand. Given this, and the substantial closed areas in the fishery, the UoA is highly unlikely to reduce structure and function of habitats.
CRITERIA: (ii) There is a strategy in place that is designed to ensure the UoA does not pose a risk of serious or irreversible harm to the habitats.
(a) Management strategy in place
| ECIFFF – general; Sea Mullet – Ocean beach (K) fishery |
LOW RISK |
|
The main management measures serving to minimise habitat impacts from the ECIFFF are:
- Limited entry;
- Gear restrictions (net length, mesh size);
- Spatial closures; and
- Temporal closures (e.g. Barramundi seasonal closure).
The impact of net fishing on bycatch and ecosystems has received at least some detailed study (e.g. Halliday et al, 2001). Given the relatively benign nature of the apparatus and the substantial spatial closures, these measures are likely to constitute at least a partial strategy to ensure the fisheries do not result in serious or irreversible harm to habitats within the fishery area.
(b) Management strategy implementation
| ECIFFF – general; Sea Mullet – Ocean beach (K) fishery |
LOW RISK |
The outcomes of Halliday et al (2001) provide some objective basis for confidence the strategy will work. These authors noted amongst other things: “from the data presented in this study it is apparent that the use of gill netting is one of the most environmentally sensitive forms of fishing used in commercial fisheries. The ability of fishers using these apparatus to capture high proportions of targeted and marketable catches using techniques that are non-destructive to habitats, and have no detectable effect on the overall species diversity of particular areas indicate that efforts to achieve further meaningful reductions in bycatch should be focused on developing markets for only a few select species.”
CRITERIA: (iii) Information is adequate to determine the risk posed to the habitat by the UoA and the effectiveness of the strategy to manage impacts on the habitat.
(a) Information quality
| ECIFFF – general; Sea Mullet – Ocean beach (K) fishery |
LOW RISK |
|
The nature, distribution and vulnerability of all habitat types with the fishery are known at a level of detail relevant to the nature and intensity of the fishery. For example, in the area of the GBRMP, a comprehensive bioregionalisation was undertaken to support the rezoning of the GBRMP (Kerrigan et al, 2010). In Moreton Bay, Stevens (2004) mapped the benthic habitat in the Marine Protected Areas of Moreton Bay, and Beumer et al. (2012) mapped the Moreton Bay area to identify vulnerable fish habitat areas.
(b) Information and monitoring adequacy
| ECIFFF – general; Sea Mullet – Ocean beach (K) fishery |
LOW RISK |
Previous studies (e.g. Halliday et al, 2001) provide insight into the potential impacts of net fishing on coastal habitats, supported by historic observer coverage. Given the relatively benign nature of the gear, commercial catch and effort logbooks provide adequate information to detect increased levels of risk, as well as relatively fine scale information on the spatial extent of interaction.
PI SCORE – LOW RISK
2D: Ecosystems
CRITERIA: (i) The UoA does not cause serious or irreversible harm to the key elements of ecosystem structure and function.
(a) Ecosystem Status
| ECIFFF – general |
LOW RISK |
|
Serious or irreversible harm in the ecosystem context should be interpreted in relation to the capacity of the ecosystem to deliver ecosystem services (MSC, 2014). Examples include trophic cascades, severely truncated size composition of the ecological community, gross changes in species diversity of the ecological community, or changes in genetic diversity of species caused by selective fishing.
Halliday et al (2001) examined the impacts of a number of sectors of the ECIFFF on species diversity and composition in areas open and closed to net fishing. They reported differences in abundance of targeted species between rivers open and closed to net fishing but did not find that abundances of prey or abundances of alternative competitors were greater in the commercially fished areas. Amongst other things they concluded “From the data presented in this study it is apparent that the use of gill netting is one of the most environmentally sensitive forms of fishing used in commercial fisheries. The ability of fishers using these apparatus to capture high proportions of targeted and marketable catches using techniques that are non-destructive to habitats, and have no detectable effect on the overall species diversity of particular areas indicate that efforts to achieve further meaningful reductions in bycatch should be focused on developing markets for only a few select species.” They also noted that “the low rates of bycatch that were established for each of the Queensland net fisheries indicates that levels of bycatch and its composition should not be an issue in relation to ecological impacts of the fisheries concerned.”
Given these results and the substantial number of closed areas to net fishing along the Queensland coast, it is highly unlikely the UoAs will disrupt the key elements underlying ecosystem structure and function to a point that would cause serious or irreversible harm.
| Ocean beach (K) fishery |
LOW RISK |
|
The ocean beach net fishery catches very few non-target species due to the highly selective nature of the gear and fishing methods (i.e. visually identifying schools of target species). Consequently, the main impact on the ecosystem is likely to be through removals of target and main other species. The fishery catches a variety of target species that utilise numerous habitats beyond those available to the fishery and are extremely mobile, making change specific to an area both unlikely and very difficult to discern. Given both Sea Mullet and Tailor stocks are both thought to be in good health and the substantial number of closed areas to the QOBNF along the southern Queensland coast, it is highly unlikely the UoAs will disrupt the key elements underlying ecosystem structure and function to a point that would cause serious or irreversible harm.
CRITERIA: (ii) There are measures in place to ensure the UoA does not pose a risk of serious or irreversible harm to ecosystem structure and function.
(a) Management Strategy in place
| ECIFFF – general; Sea Mullet – Ocean beach (K) fishery |
LOW RISK |
|
The measures to limit wider ecosystem impacts from the UoAs are largely described above. In particular, the relatively selective nature of the apparatus and the substantial closed areas will serve to limit overall impacts of fishery on the ecosystem. Ecosystem impacts from the fishery have been subject to detailed investigation (Halliday et al, 2001) and some ongoing independent monitoring.
(b) Management strategy implementation
| ECIFFF – general; Sea Mullet – Ocean beach (K) fishery |
LOW RISK |
|
The outcomes of Halliday et al (2001) provide some objective basis for confidence that the strategy will work. The management measures limiting ecosystem impacts have arguably been strengthened in the period after that study with the implementation of the GBRMP rezoning and reduction in commercial license numbers. Closed areas to the QOBNF also exist under both fisheries legislation and the MBMP and GSMP.
CRITERIA: (iii) There is adequate knowledge of the impacts of the UoA on the ecosystem.
(a) Information quality
| ECIFFF – general; Sea Mullet – Ocean beach (K) fishery |
LOW RISK |
|
Information on Queensland coastal ecosystem is comparatively very well studied, mainly through studies in support of the management of the GBRMP (see summarised in GBRMPA, 2012c; GBRMPA, 2014), as well MBMP (e.g. Stevens, 2004; Beumer et al. 2012). This information is adequate to understand the key elements of the ecosystem and to detect increased risk.
(b) Investigations of UoA impact
| E(CIFFF – general; Sea Mullet – Ocean beach (K) fishery |
LOW RISK |
|
The main impacts of the fishery on the ecosystem can be inferred from existing information and some have been investigated in detail (e.g. Halliday et al, 2001).
PI SCORE – LOW RISK
COMPONENT 3: Management system
3A: Governance and Policy
CRITERIA: (i) The management system exists within an appropriate and effective legal and/or customary framework which ensures that it:
- Is capable of delivering sustainability in the UoA(s); and
- Observes the legal rights created explicitly or established by custom of people dependent on fishing for food or livelihood.
| (a) Compatibility of laws or standards with effective management |
LOW RISK |
|
Commercial net fishing is managed by Department of Agriculture and Fisheries, Queensland, according to the Queensland Fisheries Act 1994 and Queensland Fisheries Regulation 2008. A range of other legislation also impacts on the operations of ECIFFF fishers including:
- Queensland Marine Parks Act 2004
- Queensland Marine Parks Regulation 2006 (and subsidiary zoning plans)
- Queensland Nature Conservation Act 1992.
- Commonwealth EPBC Act
- The Offshore Constitutional Settlement between the Commonwealth of Australia and the State of Queensland
- Commonwealth Great Barrier Reef Marine Park Act 1975 and Zoning Plan 2003.
This legislation provides an effective legal framework for the purposes of delivering management outcomes consistent with the outcomes expressed by Components 1 and 2.
| (b) Respect for Rights |
LOW RISK |
|
The rights of Aboriginal persons to fish for a customary purpose are recognized in the Queensland Fisheries Act and subordinate legislation. The rights of customary fishers are recognised by the s14 exemption in the Fisheries Act that allows for an “Aborigine or Torres Strait Islander” to take fish for “the purpose of satisfying a personal, domestic or non-commercial communal need”. Additional customary rights may be sought under Commonwealth Native Title legislation.
CRITERIA: (ii) The management system has effective consultation processes that are open to interested and affected parties. The roles and responsibilities of organisations and individuals who are involved in the management process are clear and understood by all relevant parties.
| (a) Roles and Responsibilities |
LOW RISK |
|
The roles and responsibilities of the main people (e.g. Fisheries Minister, Deputy Director General) and organisations (DAFF) involved in the management of the ECIFFF are well-understood, with relationships and key powers explicitly defined in legislation (e.g. Qld Fisheries Act) or relevant policy statements. The Department of Fisheries and Forestry, Queensland is responsible for the day-to day management of the fishery. In addition, GBRMPA are responsible for the broader management of the GBRMP, including spatial management decisions. Accountability relationships between the main agencies and their responsible Ministers are clear. Compliance functions are carried out primarily by the QB&FP, although GBRMPA and DERM staff are also authorised officers under the Fisheries Act.
| (b) Consultation Process |
MEDIUM RISK |
|
Until very recently, consultation was undertaken on a targeted, ad hoc basis, primarily with key stakeholder representative organisations, with formal processes to seek information from the main affected parties on important regulatory changes (e.g. release of Regulatory Impact Statements [RISs] seeking public comment). In mid-2017, a multi-stakeholder East Coast Inshore Fishery Working Group (ECIFWG) was established as part of the Queensland Government’s Sustainable Fisheries Strategy 2017-2027. The objectives of the ECIFWG are to:
- To assist with the development of fishing management options for the ECIFF Fishery consistent with the Sustainable Fisheries Strategy.
- To assist with the development of a harvest strategy for fishing within the ECIFF Fishery by the end of 2018.
- To provide advice to Fisheries Queensland on operational issues and management of fishing within the ECIFFF.
The ECIFWG includes membership from Fisheries Queensland as well as representatives from the commercial and recreational fishing sectors, seafood marketing sector, research sector, GBRMPA and the conservation sector.
Additional measures to strengthen stakeholder engagement under the Queensland Sustainable Fisheries Strategy: 2017–2027 include:
- The establishment of an expert advisory panel to provide independent advice to the responsible minister and Fisheries Queensland on best practice fisheries management and evidence-based decision-making;
- Work with Indigenous groups and communities through various forums to ensure they are engaged in fisheries management processes, such as fishery-specific harvest strategies (DAF, 2017a).
The key considerations around whether this SI scores low risk is whether the consultation process regularly seek and accept relevant information from all interested parties, including local knowledge, and whether the management system demonstrates consideration of the information obtained. The medium risk criteria require consultation processes that obtain relevant information from the main affected parties, including local knowledge, to inform the management system. While the new consultative structure appears capable of being a mechanism to meet the low risk criteria, the evidence base is limited given the working group has only recently been established. To that end, we have scored this SI medium risk given the management system does include consultation processes which seeks to obtain relevant information from the main affected parties (e.g. through RISs). Should the new consultative structure regularly seek and accept relevant information from all interested parties, including local knowledge, and demonstrates consideration of the information obtained, this SI may score low risk in future assessments.
CRITERIA: (iii) The management policy has clear long-term objectives to guide decision making that are consistent with Components 1 and 2, and incorporates the precautionary approach.
| (a) Objectives |
LOW RISK |
|
The overarching objectives for the management of Queensland fisheries set out in the Fisheries Act appear implicitly consistent with Components 1 and 2 and some are explicitly set out in the Act. The Fisheries Act 1994 states that its (1) ‘main purpose’ is to ‘provide for the use, conservation and enhancement of the community’s fisheries resources and fish habitats in a way that seeks to— (a) apply and balance the principles of ecologically sustainable development; and (b) promote ecologically sustainable development’. The Act also states that:
- ecologically sustainable development means ‘using, conserving and enhancing the community’s fisheries resources and fish habitats so that— (a) the ecological processes on which life depends are maintained; and (b) the total quality of life, both now and in the future, can be improved’; and
- Precautionary principle means that ‘if there is a threat of serious or irreversible environmental damage, lack of scientific certainty should not be used as a reason to postpone measures to prevent environment degradation, or possible environmental degradation, because of the threat’.
The Act further elaborates that the principles of ecologically sustainable development means:
- enhancing individual and community wellbeing through economic development that safeguards the wellbeing of future generations;
- providing fairness within and between generations;
- protecting biological diversity, ecological processes and life-support systems;
- in making decisions, effectively integrating fairness and short and long-term economic, environmental and social considerations;
- considering the global dimension of environmental impacts of actions and policies;
- considering the need to maintain and enhance competition, in an environmentally sound way;
- considering the need to develop a strong, growing and diversified economy that can enhance the capacity for environmental protection;
- that decisions and actions should provide for broad community involvement on issues affecting them; and the
the precautionary principle.
PI SCORE – LOW RISK
3B: Fishery Specific Management System
CRITERIA: (i) The fishery specific management system has clear, specific objectives designed to achieve the outcomes expressed by Components 1 and 2.
| (a) Objectives |
MEDIUM RISK |
|
Generic cross-fishery objectives consistent with Components 1 and 2 are specified in the Queensland Fisheries Act, as well as other policy documents (e.g. Queensland Harvest Strategy Policy; DAF, 2017b), and are therefore implicit within the fishery specific management system.
While the PMS, first introduced in 2009, set out explicit operational objectives for the ECIFFF consistent with Components 1 and 2, assessments against the PMS have been discontinued since around 2012 (DEE, 2016). There are few other fishery specific objectives explicit with the current management system.
To that end, existing arrangements appear more consistent with the medium risk SG.
CRITERIA: (ii)The fishery specific management system includes effective decision making processes that result in measures and strategies to achieve the objectives.
| (b) Decision making |
MEDIUM RISK |
|
DAF’s decision-making process is set out explicitly in relevant legislation (e.g. Fisheries Act) and policy documents. Regulatory Impact Statements are released for major regulatory changes and these set out the wider implications of decisions. There is some evidence historically that the management system has responded to serious issues (e.g. through the introduction of the Dugong Protection Areas), although the very complex nature of net fishing management arrangements in Queensland do not lend themselves to timely and adaptive decision making. The prolonged gestation of various net fishing reviews is evidence that the process has not operated at ‘low risk’ levels.
A revised decision-making framework which aims to improve flexibility and responsiveness has been proposed as part of the Queensland Government’s Sustainable Fisheries Startegy 2017-2027 (DAF, 2017a). Effective operation of the framework, together with input from the ECIFWG, may result in lower risk scores in future assessments.
| (c) Accountability and Transparency |
MEDIUM RISK |
Information on some components of the fishery’s performance (e.g. catch, effort, stock status, selected species stock assessments) are available through the DAF website, as well as other relevant websites (e.g. Status of Key Australian Fish Stocks website; Australian Government Department of Environment and Energy website). More formal annual reviews of the fishery’s performance were published as Annual Status Reports, however the most recent report was published in 2014 (for the period 2011-2014) (DAFF, 2014a). Notwithstanding that, information which would otherwise be useful in assessing the sustainability of the fishery is not published in detail, such as the stock status assessment process, observer information from the fishery and some LTMP information.
Where significant management changes are required, a RIS is released calling for public comment. The RIS provides an explanation of the background to the proposed changes and alternative options considered. Nevertheless, in the absence of any formal consultative structure, it is not clear that explanations have been provided for any actions or lack of action associated with findings and relevant recommendations emerging from research, monitoring evaluation and review activity. Accordingly, we have scored this SI medium risk. We note that the newly established ECIFWG – and the public Communiques made available through the DAF website following each meeting – provides a mechanism through which explanations may be provided to stakeholders on any action or lack of action around recommendations arising from research and monitoring.
CRITERIA: (iii) Monitoring, control and surveillance mechanisms ensure the management measures in the fishery are enforced and complied with.
| (a) MCS Implementation |
LOW RISK |
|
The main measures in the MCS system include licensing, catch and effort reporting, quota monitoring for relevant species and on water patrols. General statistics on rates of compliance amongst both commercial and recreational fishers suggest that the system has demonstrated an ability to enforce relevant management measures, strategies and/or rules. Compliance rates amongst the commercial sector are reported to have ranged between 93.7% and 94.8% between 2011 and 2013 (DAFF, 2014a), although more recent statistics are not available.
| (b) Sanctions and Compliance |
MEDIUM RISK |
|
The Queensland Boating and Fisheries Patrol (QBFP) enforces fisheries and boating safety laws through surveillance and inspection, as well as undertaking related education with industry and community groups. The Regulations specify what constitutes a ‘serious fisheries offence’ including contravention of particular fisheries declarations, undertaking prohibited acts about regulated fish, quota offences, contravening a condition of an authority, use of explosives etc, undertaking a prescribed act, possessing or releasing a noxious fisheries resources, possessing or releasing an indigenous fisheries resources, contravening information requirements, providing false, misleading or incomplete documents, obstruction etc of an inspector. A serious fisheries offence can also be prescribed under a relevant fisheries management plan.
Those convicted of a fisheries offence may be refused application for a new or renewed fishing authority (59(1)). The Chief Executive Officer may cancel or suspend an authority if the holder of the authority has been convicted of a fisheries offence (68A). Furthermore, the court may, in addition to, or instead of, imposing the fine prescribed under this Act for the offence, suspend or cancel the authority and any quota relating to the authority (68B).
While the available statistics on compliance rates suggest that fishers generally comply with the management system (e.g. compliance rates are reported to have ranged between 93.7% and 94.8% in the ECIFFF during 2011 to 2013; DAFF, 2014a), there is uncertainty over the extent which fishers comply with SOCI logbook reporting obligations. Accordingly, we have scored this SI medium risk.
CRITERIA: (iv) There is a system for monitoring and evaluating the performance of the fishery specific management system against its objectives.
There is effective and timely review of the fishery specific management system.
| (a) Evaluation coverage |
MEDIUM RISK |
|
A PMS has been in place for the fishery since 2009 to evaluate performance of the management system (DEEDI, 2009), although DEE (2016) indicate assessments against the PMS have not been undertaken since 2012. In recent years, the effectiveness of the management system for targeted commercial species has been primarily assessed in the context of the annual stock status assessment process. Effectiveness of some Component 2 management arrangements are evaluated in the context of periodic EPBC WTO assessments and annual SOCI reporting. There are few mechanisms in place to monitor and evaluate the performance of non-target species management measures. To that end, the fisheries meet the medium risk SG in that mechanisms are in place to evaluate some parts of the fishery-specific management system.
| (b) Internal and/or external review |
LOW RISK |
|
Internal review of the management system has historically occurred through the triggering of performance measures under the PMS. In recent years, internal reviews have been performed in response to conditions placed on the fishery through the EPBC assessment process (e.g. DAFF, 2014b,c), as well as in response to species-specific issues (e.g. introduction of new management arrangements for hammerhead sharks in 2018[1]). Periodic external review of the fishery also occurs through the EPBC export accreditation process. The fishery was most recently assessed in 2016, with the relevant wildlife trade operation declaration extended for two years, until 28 September 2018. In 2008, an independent review of the ECIFFF was performed (Gunn et al. 2008). The Queensland fisheries management system was externally reviewed in 2014 (MRAG Asia Pacific, 2014).
[1] https://www.daf.qld.gov.au/about-us/news-and-updates/fisheries/news/new-rules-commence-for-hammerhead-sharks
PI SCORE – MEDIUM RISK
Acknowledgements
This seafood risk assessment procedure was originally developed for Coles Supermarkets Australia by MRAG Asia Pacific. FRDC is grateful for Coles’ permission to use its Responsibly Sourced Seafood Framework.
It uses elements from the GSSI benchmarked MSC Fishery Standard version 2.0, but is neither a duplicate of it nor a substitute for it. The methodology used to apply the framework differs substantially from an MSC Certification. Consequently, any claim about the rating of the fishery based on this assessment should not make any reference to the MSC.